Building a serverless hosting platform
May 2020
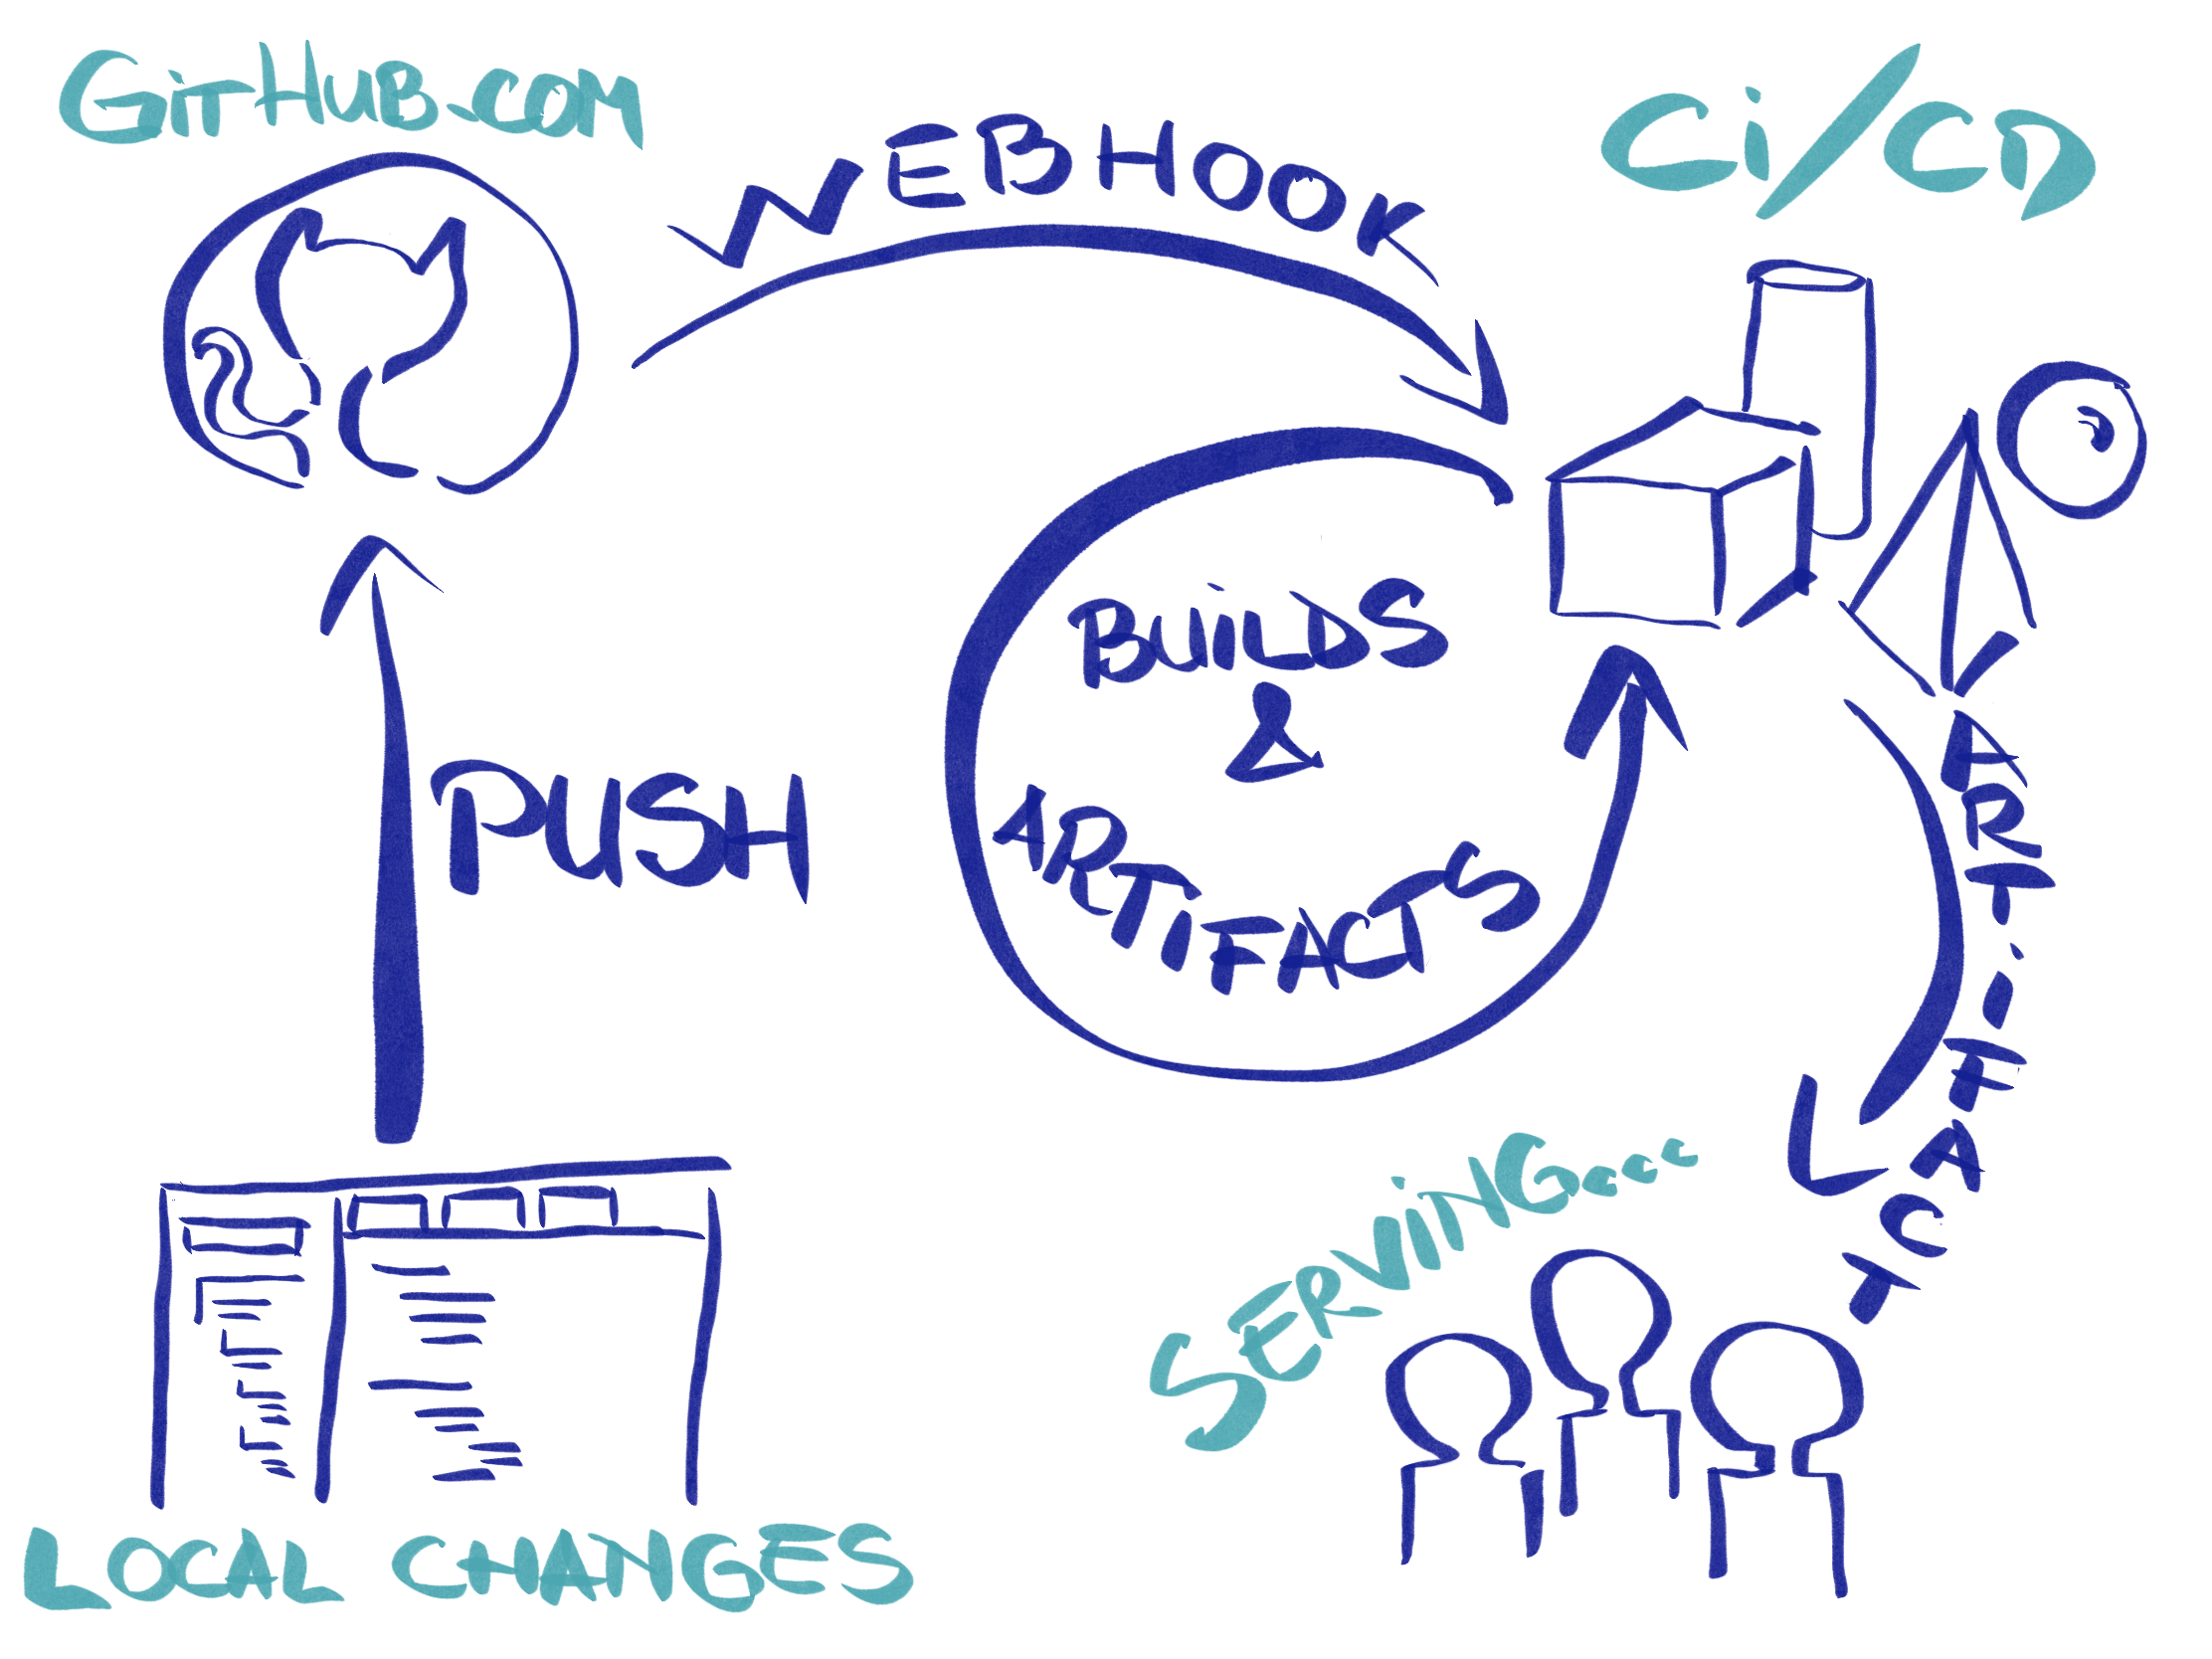
Deploying a 3-tier application (with the presentation layer, business logic, and storage) can get a little tricky these days. Let’s say that we have a simple Django application, poll’s app from the tutorial. It runs perfect on our local machine, we added a requirements.txt to hold our dependencies. As for the database, we can use SQLite, since we’re developing only locally. The purpose of this project is to build a system that will allow us to push on a branch and deploy our changes in a separate environment, giving us a unique URL, to check them. Similarly to how now.sh and heroku.com are doing. We’ll need a mechanism that will package our code and dependencies and will deploy it, but also it needs to consider multiple versions, upgrades, load-balacing, scaling and our stateful part (database).
- Packet
- Kubernetes on bare-metal
- MetalLB
- Istio
- First Knative service
- ElasticSearch and Kibana
- Autoscaling
- Mysql
Introduction
In order to achieve that, we’ll need two main components: one component that will take our code and prepare it to be published, namely the CI/CD component, and another one that will expose the changes to the Internet, namely the serving component. We can add a third component to hold some state for our application, like database and storage, but we’ll add it to the serving component.
Serving component
For the serving component, we can use Knative. It leverages Kubernetes and integrates components that are already built on top of Kubernetes. At it’s very basic, it runs and exposes a Docker image to the Internet, without any fuss. You’ll just have to define a service that describe your image and its environment and Knative will take care of everything else (from routing, logging, monitoring to managing different versions of your application and autoscaling, including 0 scaling for no use).
As you can imagine, Knative is way more complex than it can be described in a paragraph and currently, we’ll not dissect it.
Packet
In order to move forward with Knative, we’ll need a Kubernetes cluster. For the sake of over-engineering it and trying something new, let’s try to install Kubernetes on bare-metal. It sounds a little overwhelming, but in the end, it is way simpler than anticipated. I’ve always wanted to try packet.com, since they have automated their deployment (it can be controlled via an API, thus allowing tools like Terraform to shine), they have a marketplace on which you can bid for machine’s usage per hour (called Spot Market, accessible via their API) and neat networking features (like BGP - Border Gateway Protocol, which will need further).
We can choose from 3 deployment types: on-demand, reserved and spot. Let’s try the spot instances since those can be really cheap.
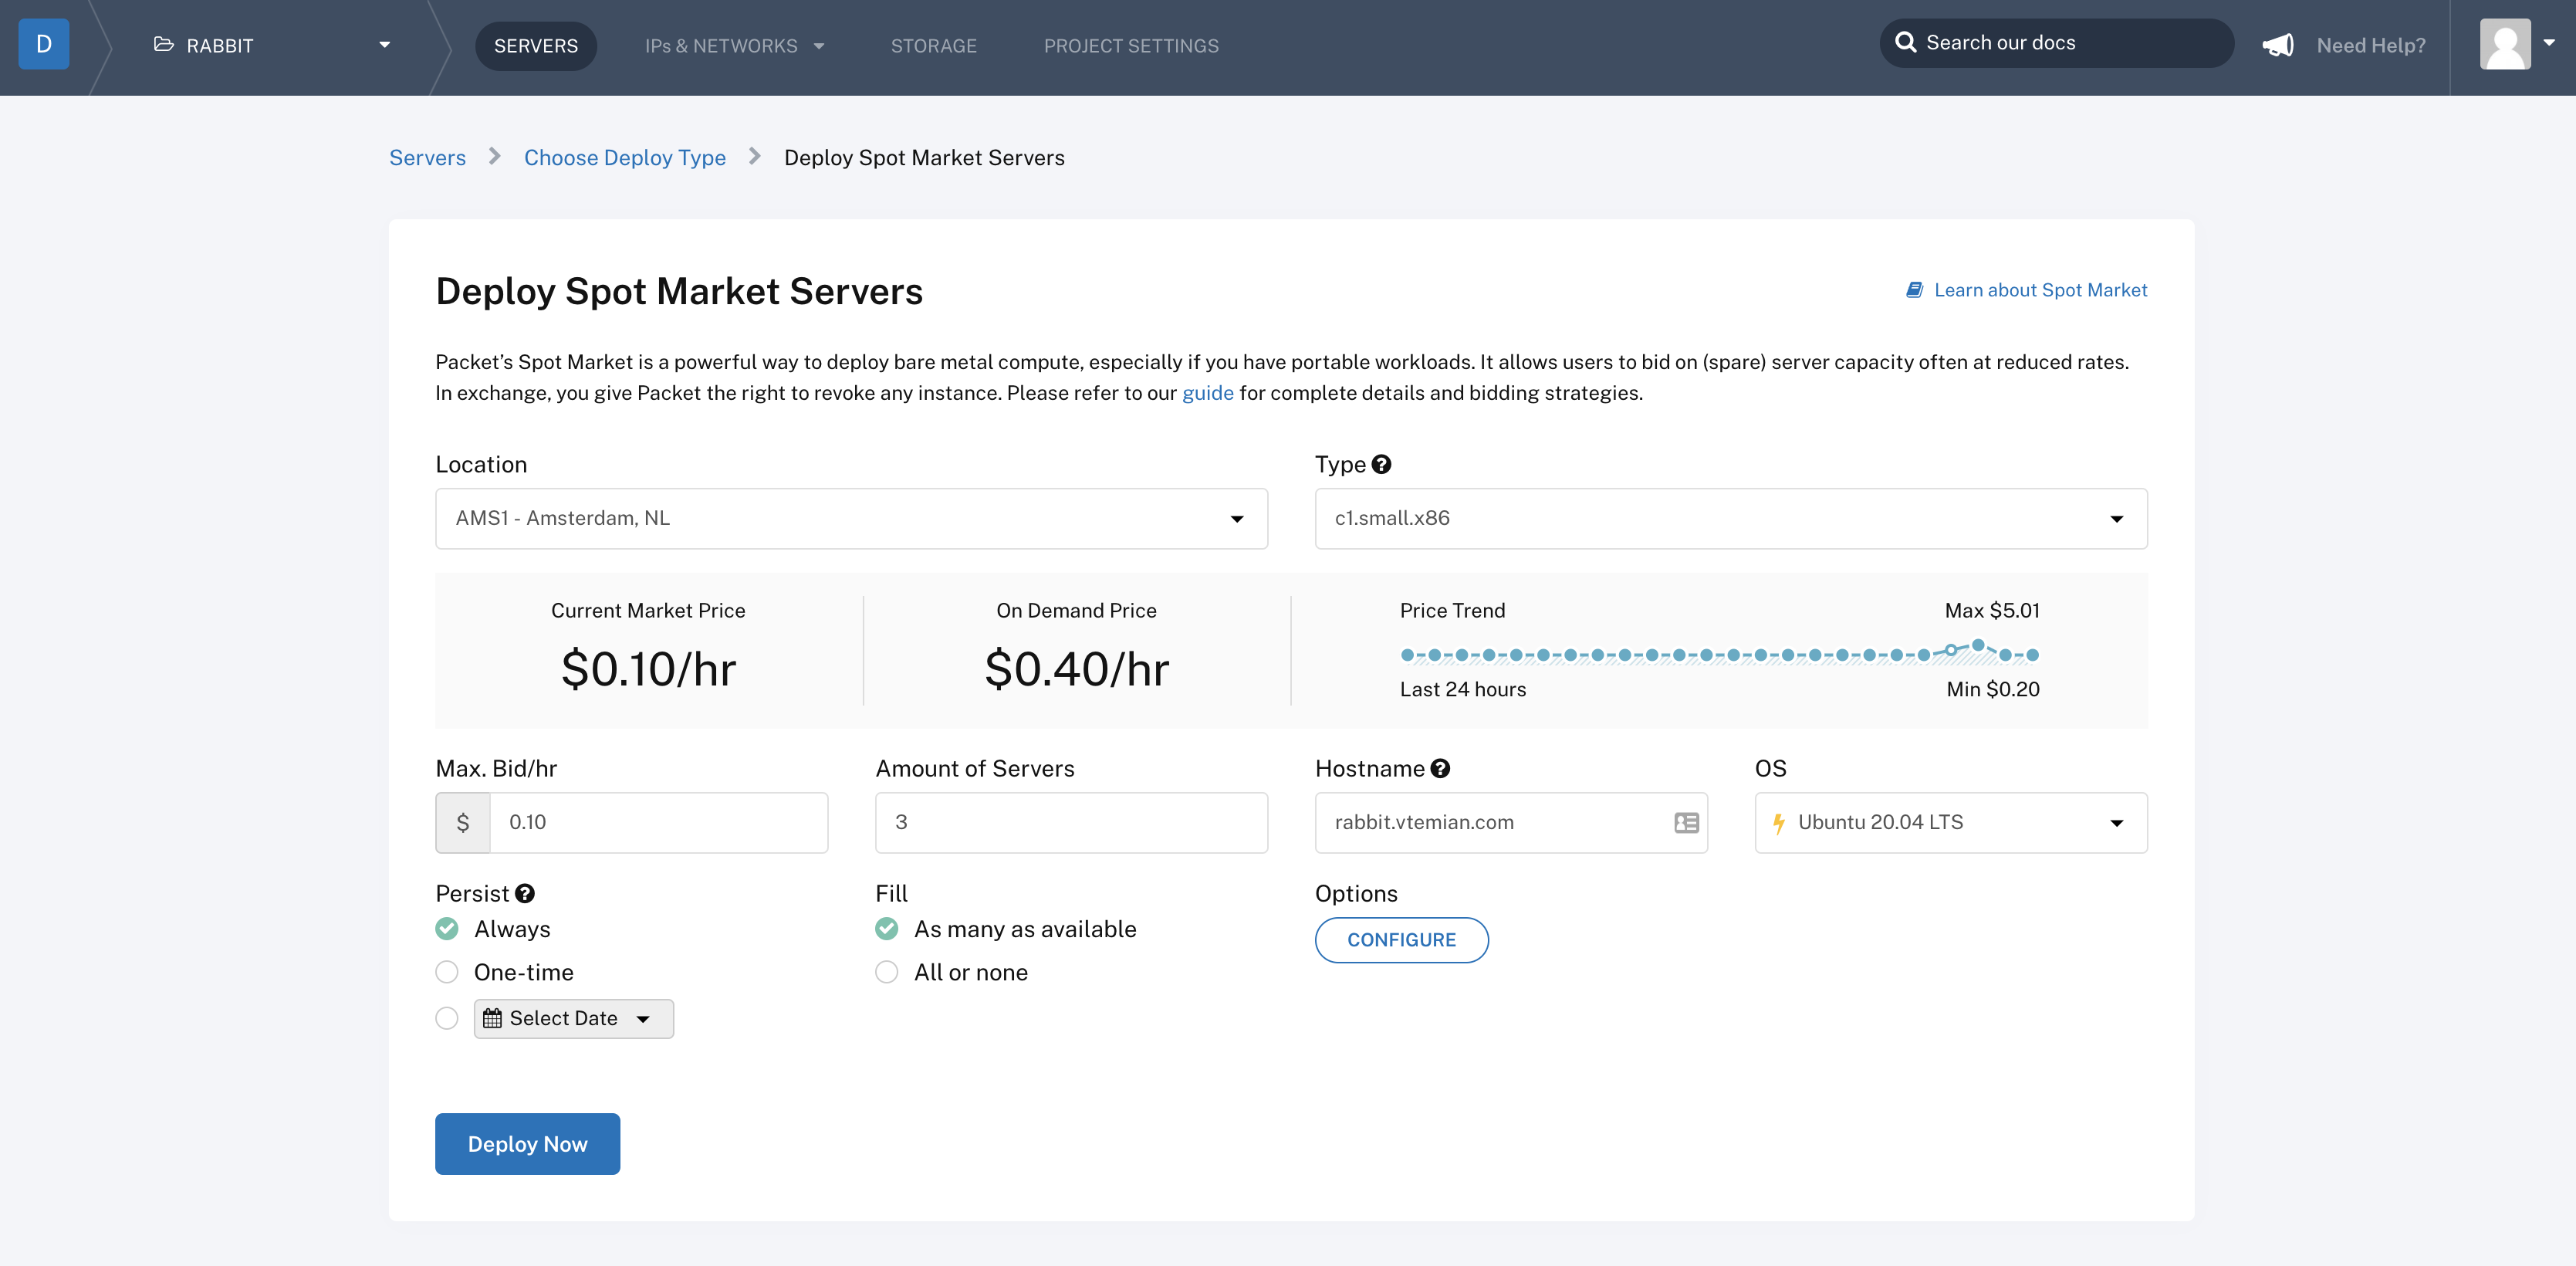
Once a spot market request was created, it will check for available machines that comply with your bid, and start provisioning them. For a max bid of $0.10 / h, we get a c1.small.x86 instance, with 4 physical cores running at 3.4Ghz (Intel E3-1240 v3), 32GB RAM, 2 x 120GB SSD and 2 Gigabit NICs.
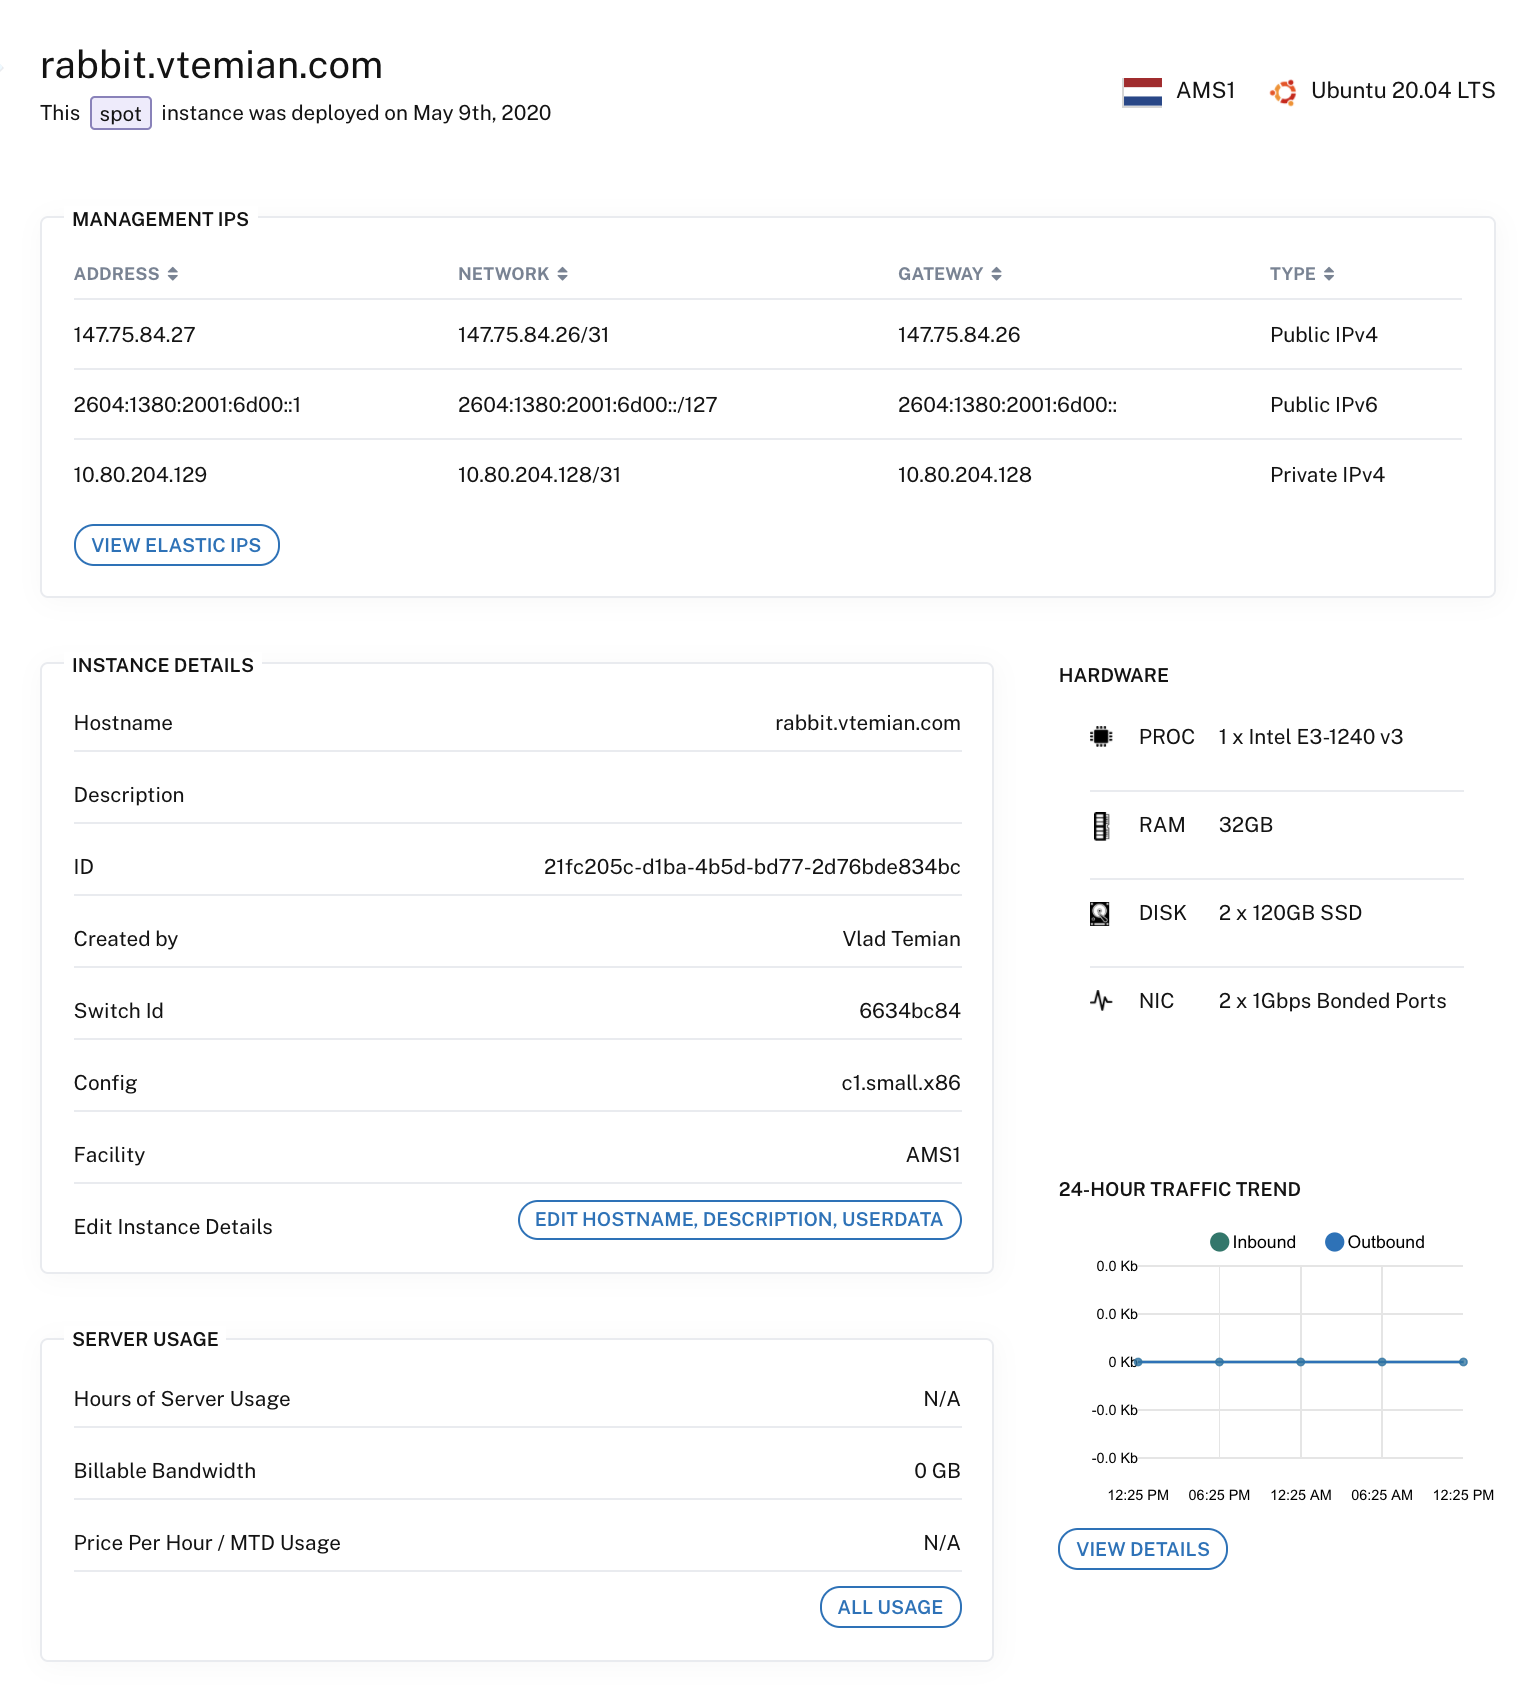
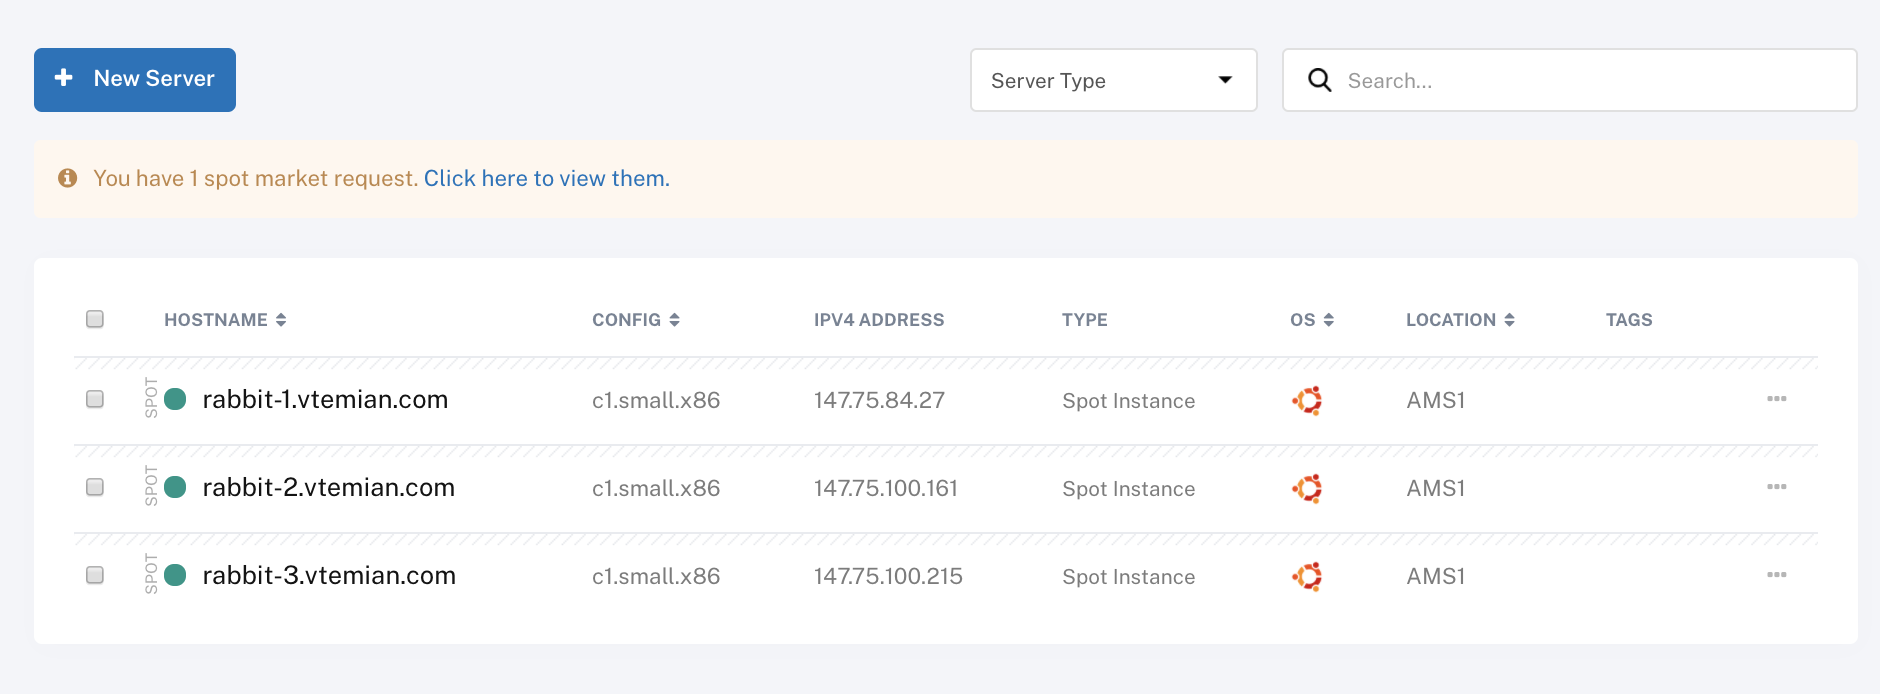
I’ve updated the hostname for each of one and now we’re ready to install Kubernetes.
Kubernetes on bare-metal
There are tons of guides out there on how to install Kubernetes on bare metal, from installing all the components manually to using scripts or other tools. The most popular choices are kops, kubeadm and kubespray. I went with kubespray since, for me, it was easier to understand and it was the path with the least resistance to follow since I have some ansible experience. Here you can find a small comparison between kops, kubeadm, and kubespray.
Kubespray is easy to install and to use. We just need to clone the repository and install it using
sudo pip3 install -r requirements.txt
We can also install it in a separate virtual environment if we have different versions of ansible running on your machine.
Next, we need to define an inventory of servers. It comes with pre-defined inventory examples. We can use Packet’s API to list all your servers, but I decided to use a static one. Just copy the sample inventory into a separate one (I’ve called it rabbit).
cd kubespray
cp -R inventory/sample/ intentory/rabbit
Now add our servers in inventory.ini
[all]
rabbit-1.vtemian.com ansible_host=147.75.84.27 ansible_user=root ip=10.80.204.129 etcd_member_name=etcd1
rabbit-2.vtemian.com ansible_host=147.75.100.161 ansible_user=root ip=10.80.204.131 etcd_member_name=etcd2
rabbit-3.vtemian.com ansible_host=147.75.100.215 ansible_user=root ip=10.80.204.133 etcd_member_name=etcd3

[kube-master]
rabbit-1.vtemian.com

[etcd]
rabbit-1.vtemian.com

[kube-node]
rabbit-2.vtemian.com
rabbit-3.vtemian.com

[calico-rr]

[k8s-cluster:children]
kube-master
kube-node
calico-rr
Because when I was setting up my cluster, kubespray didn’t fully supported Ubuntu 20.04, I had to update the tasks a little bit. I’ve replaced python-minimal with python2-minimal and install Docker from Ubuntu 19.10 (Eoan) repositories.
Next, we just need to run ansible and let it do the magic.
ansible-playbook --become -i inventory/rabbit/inventory.ini cluster.yml
If everything worked as intended, we’ll have a new cluster, up and running. In order to access it, we can grab the admin credentials, from the kube-master node.
scp root@rabbit-1.vtemian.com:/etc/kubernetes/admin.conf .
Next, add those into our local kubectl config (usually located at ~/.kube/config) and we’ll be able to access the cluster, using kubectl.
╰─>$ kubectl get pod --all-namespaces -o wide
NAMESPACE     NAME                                           READY   STATUS    RESTARTS   AGE     IP              NODE                   NOMINATED NODE   READINESS GATES
kube-system   calico-kube-controllers-5679c8548f-rffvp       1/1     Running   0          2m46s   10.80.204.133   rabbit-3.vtemian.com   <none>           <none>
kube-system   calico-node-6wt2p                              1/1     Running   1          3m12s   10.80.204.129   rabbit-1.vtemian.com   <none>           <none>
kube-system   calico-node-98cnq                              1/1     Running   1          3m12s   10.80.204.131   rabbit-2.vtemian.com   <none>           <none>
kube-system   calico-node-kh9k8                              1/1     Running   1          3m12s   10.80.204.133   rabbit-3.vtemian.com   <none>           <none>
kube-system   coredns-76798d84dd-75tz6                       1/1     Running   0          2m21s   10.233.82.1     rabbit-1.vtemian.com   <none>           <none>
kube-system   coredns-76798d84dd-bqt66                       1/1     Running   0          2m17s   10.233.80.1     rabbit-3.vtemian.com   <none>           <none>
kube-system   dns-autoscaler-85f898cd5c-nskgf                1/1     Running   0          2m18s   10.233.82.2     rabbit-1.vtemian.com   <none>           <none>
kube-system   kube-apiserver-rabbit-1.vtemian.com            1/1     Running   0          4m58s   10.80.204.129   rabbit-1.vtemian.com   <none>           <none>
kube-system   kube-controller-manager-rabbit-1.vtemian.com   1/1     Running   0          4m58s   10.80.204.129   rabbit-1.vtemian.com   <none>           <none>
kube-system   kube-proxy-4ktbs                               1/1     Running   0          3m34s   10.80.204.131   rabbit-2.vtemian.com   <none>           <none>
kube-system   kube-proxy-kd6n2                               1/1     Running   0          3m34s   10.80.204.133   rabbit-3.vtemian.com   <none>           <none>
kube-system   kube-proxy-ts8nw                               1/1     Running   0          3m34s   10.80.204.129   rabbit-1.vtemian.com   <none>           <none>
kube-system   kube-scheduler-rabbit-1.vtemian.com            1/1     Running   0          4m58s   10.80.204.129   rabbit-1.vtemian.com   <none>           <none>
kube-system   kubernetes-dashboard-77475cf576-7sdr6          1/1     Running   0          2m15s   10.233.83.2     rabbit-2.vtemian.com   <none>           <none>
kube-system   kubernetes-metrics-scraper-747b4fd5cd-k96pn    1/1     Running   0          2m15s   10.233.83.1     rabbit-2.vtemian.com   <none>           <none>
kube-system   nginx-proxy-rabbit-2.vtemian.com               1/1     Running   0          3m35s   10.80.204.131   rabbit-2.vtemian.com   <none>           <none>
kube-system   nginx-proxy-rabbit-3.vtemian.com               1/1     Running   0          3m36s   10.80.204.133   rabbit-3.vtemian.com   <none>           <none>
kube-system   nodelocaldns-9l6vf                             1/1     Running   0          2m17s   10.80.204.133   rabbit-3.vtemian.com   <none>           <none>
kube-system   nodelocaldns-blbcb                             1/1     Running   0          2m17s   10.80.204.131   rabbit-2.vtemian.com   <none>           <none>
kube-system   nodelocaldns-vrspt                             1/1     Running   0          2m17s   10.80.204.129   rabbit-1.vtemian.com   <none>           <none>
MetalLB
Going further, we should be able to install Knative. A big step in Knative’s installation is the routing component. It supports multiple networking layers (Ambassador, Contour, Gloo, Istio, and Kourier). The only problem is that those layers need a load balancer that will be exposed to the Internet (an external LoadBalancer). Kubernetes doesn’t have native support for that. Basically, the current implementations are vendor-specific (AWS, GCP, Azure etc.) and because we’re on bare-metal, we can’t afford the luxury of using one of those.
Luckily, there’s an implementation for bare-metal, called MetalLB. It can do that in two ways: at layer 2 using ARP/NDP or by leveraging BGP. Because Packet has support for BGP and they also provide a useful example on how to configure MetalLB, we’ll give them a try.
The instructions from Packet’s BGP - Kubernetes integration are well documented and easy to follow. We just need to be careful with the IPPools. Before defining them, I’ve configured 2 sets of elastic IPs:
A global IP 147.75.40.130/32 and a Public IPv4 147.75.80.160/30.
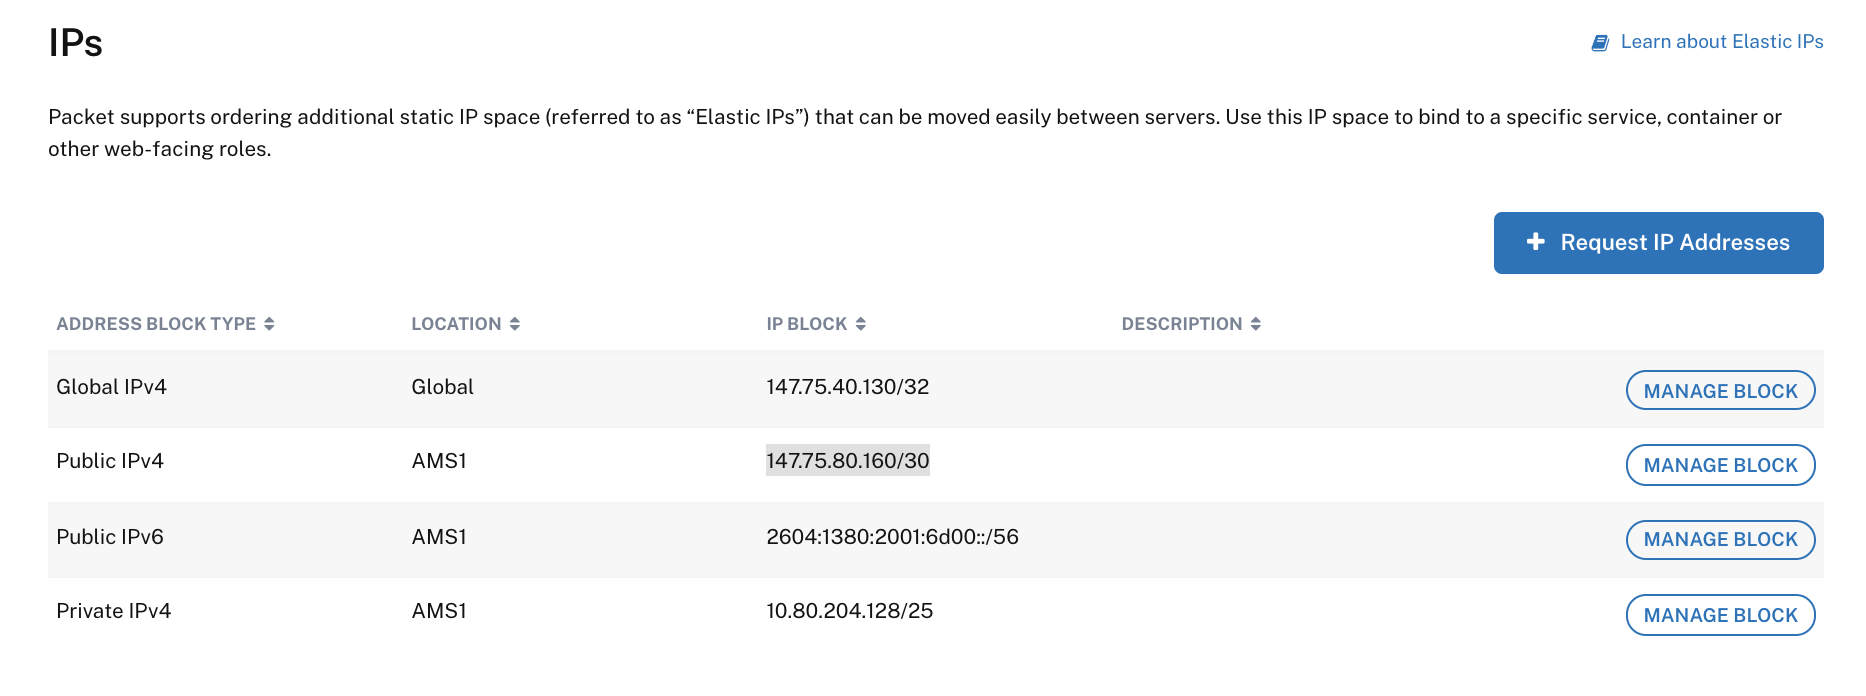
For security reasons, you’ll need to manually configure the IPs, for each server. Its fairly easy to do it and well documented. For each server, attach them an IP from the Network section:
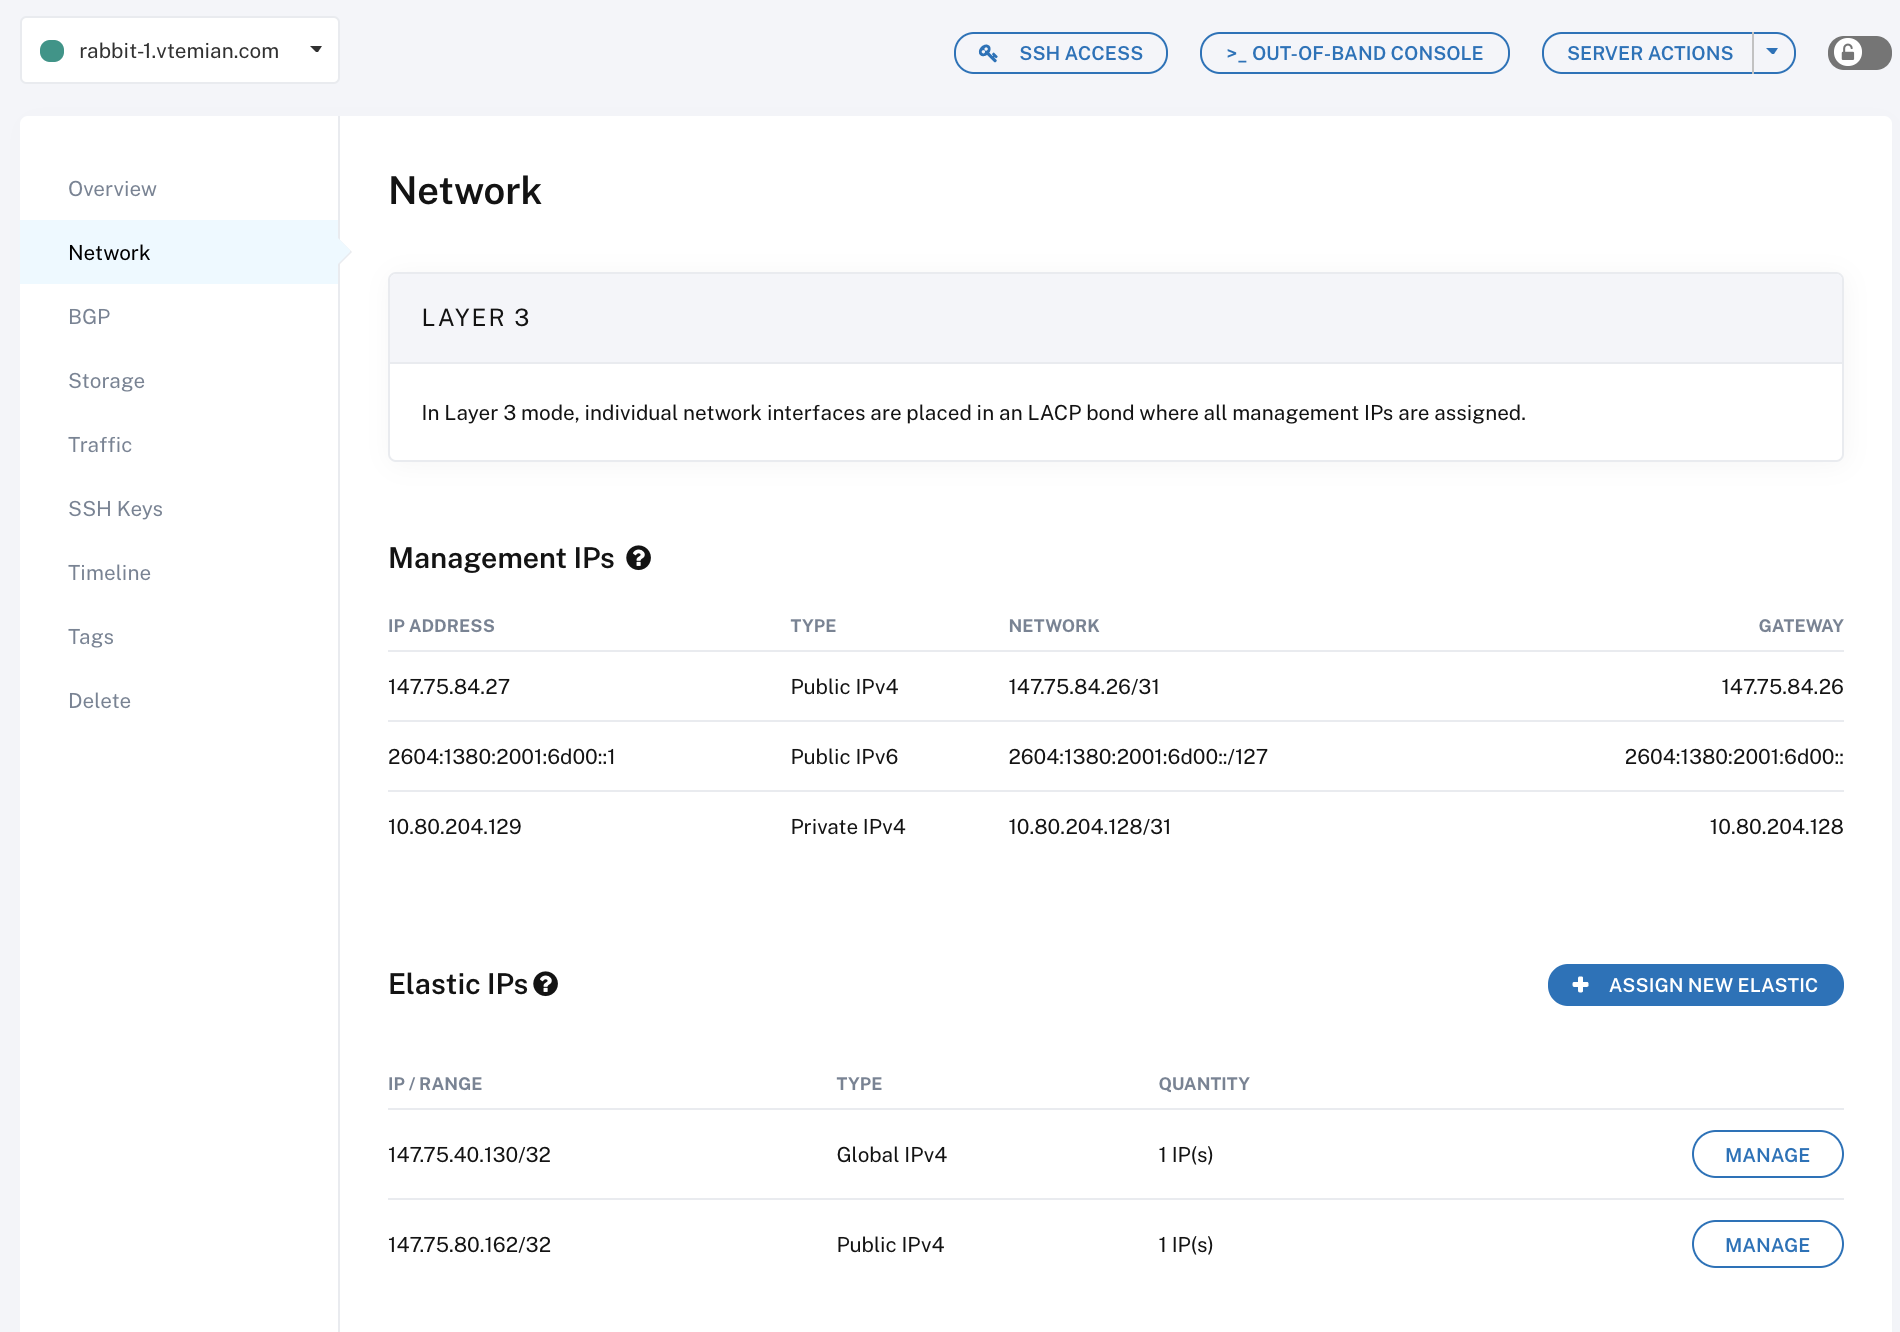
And that, on each server manually (or via ansible), an example for Ubuntu/Debian, if you just want to play around with, run:
sudo ip addr add <elastic-ip> dev lo
To make it permanent, we’ll need to edit /etc/network/interfaces
auto lo:0
iface lo:0 inet static
    address <elastic-ip>
    netmask 255.255.255.255
Continuing with the IPPools configuration, for metallb-ewr1-public will have 147.75.80.160/30, for metallb-global-ips will have 147.75.40.130/32 and for metallb-private will have our private nodes subnet, which in the current case should be 10.80.204.128/29. You can play around with the node’s private ips and a CIDR-IP conversion tool.
For each calico peer config (worker), we’ll put node’s private IP.
Next, we’ll install the latest metalLB manifest:
kubectl apply -f https://raw.githubusercontent.com/google/metallb/v0.8.1/manifests/metallb.yaml
Followed by the metalLB’s config map, in metallb-system namespace:
apiVersion: v1
kind: ConfigMap
metadata:
  namespace: metallb-system
  name: config
data:
  config: |
    peers:
    - peer-address: 127.0.0.1
      peer-asn: 65000
      my-asn: 65480
    address-pools:
    - name: ewr1-public
      protocol: bgp
      addresses:
      - 147.75.80.160/30
    - name: ewr1-private
      protocol: bgp
      addresses:
      - 10.80.204.128/29
    - name: global-ip
      protocol: bgp
      addresses:
      - 147.75.40.130/32
We can check if everything is configured correctly, by running calicoctl node status in our master node:
root@rabbit-1:~# calicoctl node status
Calico process is running.

IPv4 BGP status
+----------------+-------------------+-------+----------+-------------+
|  PEER ADDRESS  |     PEER TYPE     | STATE |  SINCE   |    INFO     |
+----------------+-------------------+-------+----------+-------------+
| 147.75.100.215 | node-to-node mesh | up    | 13:46:38 | Established |
| 127.0.0.1      | global            | up    | 13:51:44 | Established |
| 147.75.100.161 | node-to-node mesh | up    | 13:47:27 | Established |
+----------------+-------------------+-------+----------+-------------+
And other kubectl commands:
╰─>$ kubectl get pod -n kube-system -o wide | grep calico-node

calico-node-479fz                              1/1     Running   0          8m25s   10.80.204.133   rabbit-3.vtemian.com   <none>           <none>
calico-node-846gr                              1/1     Running   0          7m18s   10.80.204.131   rabbit-2.vtemian.com   <none>           <none>
calico-node-tpnjc                              1/1     Running   0          8m8s    10.80.204.129   rabbit-1.vtemian.com   <none>           <none>
╰─>$ kubectl get pod -n metallb-system -o wide

NAME                          READY   STATUS    RESTARTS   AGE    IP              NODE                   NOMINATED NODE   READINESS GATES
controller-6bcfdfd677-nxnw8   1/1     Running   0          5m4s   10.233.65.193   rabbit-3.vtemian.com   <none>           <none>
speaker-d6kks                 1/1     Running   0          5m4s   10.80.204.131   rabbit-2.vtemian.com   <none>           <none>
speaker-kk85w                 1/1     Running   0          5m4s   10.80.204.133   rabbit-3.vtemian.com   <none>           <none>
speaker-p4lc7                 1/1     Running   0          5m4s   10.80.204.129   rabbit-1.vtemian.com   <none>           <none>
Istio
Now that we have the MetalLB up and running we can continue with the last routing component. Between all those networking components that Knative supports, I’ve chosen Istio, because it is the only one compatible with the Knative operator (which will be mention further).
We just need to follow the instructions from the main install page and if everything worked, we’ll have a load balancer, with an external IP.
╰─>$ kubectl get service --all-namespaces
NAMESPACE      NAME                        TYPE           CLUSTER-IP      EXTERNAL-IP     PORT(S)                                                                                                                                      AGE
default        kubernetes                  ClusterIP      10.233.0.1      <none>          443/TCP                                                                                                                                      101m
istio-system   istio-ingressgateway        LoadBalancer   10.233.24.125   147.75.80.160   15020:30935/TCP,80:31380/TCP,443:31390/TCP,31400:31400/TCP,15029:31350/TCP,15030:31699/TCP,15031:32315/TCP,15032:31519/TCP,15443:32542/TCP   55s
istio-system   istio-pilot                 ClusterIP      10.233.48.55    <none>          15010/TCP,15011/TCP,8080/TCP,15014/TCP                                                                                                       55s
kube-system    coredns                     ClusterIP      10.233.0.3      <none>          53/UDP,53/TCP,9153/TCP                                                                                                                       98m
kube-system    dashboard-metrics-scraper   ClusterIP      10.233.61.223   <none>          8000/TCP                                                                                                                                     97m
kube-system    kubernetes-dashboard        ClusterIP      10.233.16.174   <none>          443/TCP                                                                                                                                      97m
Knative
We’re ready to install Knative. I found that the easier path is to install the common operator that will further install all the components. I’ve tried installing each component manually, but it can get really tricky.
For now, we need to install the operator in the default namespace, since it will look for a ConfigMap called config-loggin in the default namespace.
╰─>$ kubens default
╰─>$ kubectl apply -f https://github.com/knative-sandbox/operator/releases/download/v0.14.1/operator.yaml
Once the CRDs are installed and the operator’s pods are running
╰─>$ kubectl get pods
NAME                                         READY   STATUS    RESTARTS   AGE
knative-eventing-operator-5847fcc5d5-d4cb4   1/1     Running   0          53s
knative-serving-operator-587dcd9f85-zlx7v    1/1     Running   0          53s
We can create the KnativeServing and KnativeEventing resources:
╰─>$ cat <<-EOF | kubectl apply -f -
apiVersion: operator.knative.dev/v1alpha1
kind: KnativeServing
metadata:
  name: ks
EOF

╰─>$ cat <<-EOF | kubectl apply -f -
apiVersion: v1
kind: Namespace
metadata:
 name: knative-eventing
---
apiVersion: operator.knative.dev/v1alpha1
kind: KnativeEventing
metadata:
  name: ke
  namespace: knative-eventing
EOF
New pods and resources are being installed in the default and knative-eventing namespaces
╰─>$ kubectl get pods --all-namespaces -o wide
NAMESPACE          NAME                                           READY   STATUS      RESTARTS   AGE     IP              NODE                   NOMINATED NODE   READINESS GATES
default            activator-65fc4d666-7bwst                      1/1     Running     0          39s     10.233.125.68   rabbit-2.vtemian.com   <none>           <none>
default            autoscaler-74b4bb97bd-ghj59                    1/1     Running     0          38s     10.233.65.195   rabbit-3.vtemian.com   <none>           <none>
default            autoscaler-hpa-594f68d5c4-8qtg4                1/1     Running     0          30s     10.233.65.198   rabbit-3.vtemian.com   <none>           <none>
default            controller-6b6978c965-rqb2z                    1/1     Running     0          37s     10.233.65.196   rabbit-3.vtemian.com   <none>           <none>
default            istio-webhook-856d84fbf9-wvpph                 1/1     Running     0          26s     10.233.125.71   rabbit-2.vtemian.com   <none>           <none>
default            knative-eventing-operator-5847fcc5d5-d4cb4     1/1     Running     0          3m18s   10.233.125.67   rabbit-2.vtemian.com   <none>           <none>
default            knative-serving-operator-587dcd9f85-zlx7v      1/1     Running     0          3m18s   10.233.125.66   rabbit-2.vtemian.com   <none>           <none>
default            networking-istio-6845f7cf59-bsqc2              1/1     Running     0          26s     10.233.125.69   rabbit-2.vtemian.com   <none>           <none>
default            webhook-577576647-wrw56                        1/1     Running     0          36s     10.233.65.197   rabbit-3.vtemian.com   <none>           <none>
istio-system       istio-ingressgateway-75694cd848-l6zfh          1/1     Running     0          64m     10.233.125.65   rabbit-2.vtemian.com   <none>           <none>
istio-system       istio-pilot-576d858689-zxv76                   1/1     Running     0          64m     10.233.65.194   rabbit-3.vtemian.com   <none>           <none>
knative-eventing   broker-controller-854447b8d7-vdmdz             1/1     Running     0          18s     10.233.65.200   rabbit-3.vtemian.com   <none>           <none>
knative-eventing   broker-filter-b54b58854-w9jvw                  1/1     Running     0          17s     10.233.125.72   rabbit-2.vtemian.com   <none>           <none>
knative-eventing   broker-ingress-75b6b8df8d-mlppj                1/1     Running     0          16s     10.233.65.201   rabbit-3.vtemian.com   <none>           <none>
knative-eventing   eventing-controller-694594fdd7-gj2br           1/1     Running     0          26s     10.233.125.70   rabbit-2.vtemian.com   <none>           <none>
knative-eventing   eventing-webhook-6c6b675b6f-t4ntx              1/1     Running     0          26s     10.233.65.199   rabbit-3.vtemian.com   <none>           <none>
knative-eventing   imc-controller-7bb9bd7c6d-q2tsz                1/1     Running     0          10s     10.233.125.73   rabbit-2.vtemian.com   <none>           <none>
knative-eventing   imc-dispatcher-6cc5c74c7f-kdj7v                1/1     Running     0          10s     10.233.125.74   rabbit-2.vtemian.com   <none>           <none>
knative-eventing   mt-broker-controller-75ddc75d57-rg6jd          1/1     Running     0          15s     10.233.65.202   rabbit-3.vtemian.com   <none>           <none>
knative-eventing   v0.14.0-upgrade-4sv89                          0/1     Completed   0          9s      10.233.65.203   rabbit-3.vtemian.com   <none>           <none>
Before we actually test it, let’s configure the DNS component. We’ll want to have a unique URL generated each time a new deployment is created. Knative can do that using xip.io and we just need to create a job (we’ll need to install it in the default namespace):
╰─>$ kubectl apply --filename https://storage.googleapis.com/knative-nightly/serving/latest/serving-default-domain.yaml
First Knative service
Within our initial application, I’ve created a simple Dockerfile:
FROM python:3.7-slim

WORKDIR /app

COPY requirements.txt ./
RUN pip install -r requirements.txt

COPY app ./

CMD exec gunicorn app.wsgi --bind :$PORT --workers 1 --threads 8 --timeout 0
And published the image, publicly, under vtemian/simple-django-app.
╰─>$ docker push vtemian/simple-django-app
The push refers to repository [docker.io/vtemian/simple-django-app]
7aa16540cfca: Pushed
2e02cc50aabc: Pushed
768f0318f857: Pushed
663045c38f65: Pushed
715414420313: Mounted from vtemian/helloworld-python
dba4fa00b93a: Mounted from vtemian/helloworld-python
9f690547ed37: Mounted from vtemian/helloworld-python
6376837eded8: Mounted from vtemian/helloworld-python
c2adabaecedb: Mounted from vtemian/helloworld-python
latest: digest: sha256:78799d85949e31728c70ef3dbf3a492d932fc94c140cf1047d948c89141f55ab size: 2205
To publish it on our Knative installation, we just need to define a service:
apiVersion: serving.knative.dev/v1
kind: Service
metadata:
  name: simple-django-app
  namespace: default
spec:
  template:
    spec:
      containers:
      - image: docker.io/vtemian/simple-django-app
Aaaaaand kubectl get ksvc:
╰─>$ kubectl get ksvc
NAME                URL                                                     LATESTCREATED             LATESTREADY   READY     REASON
simple-django-app   http://simple-django-app.default.147.75.80.160.xip.io   simple-django-app-hc2qv                 Unknown   RevisionMissing
Going to the generated URL
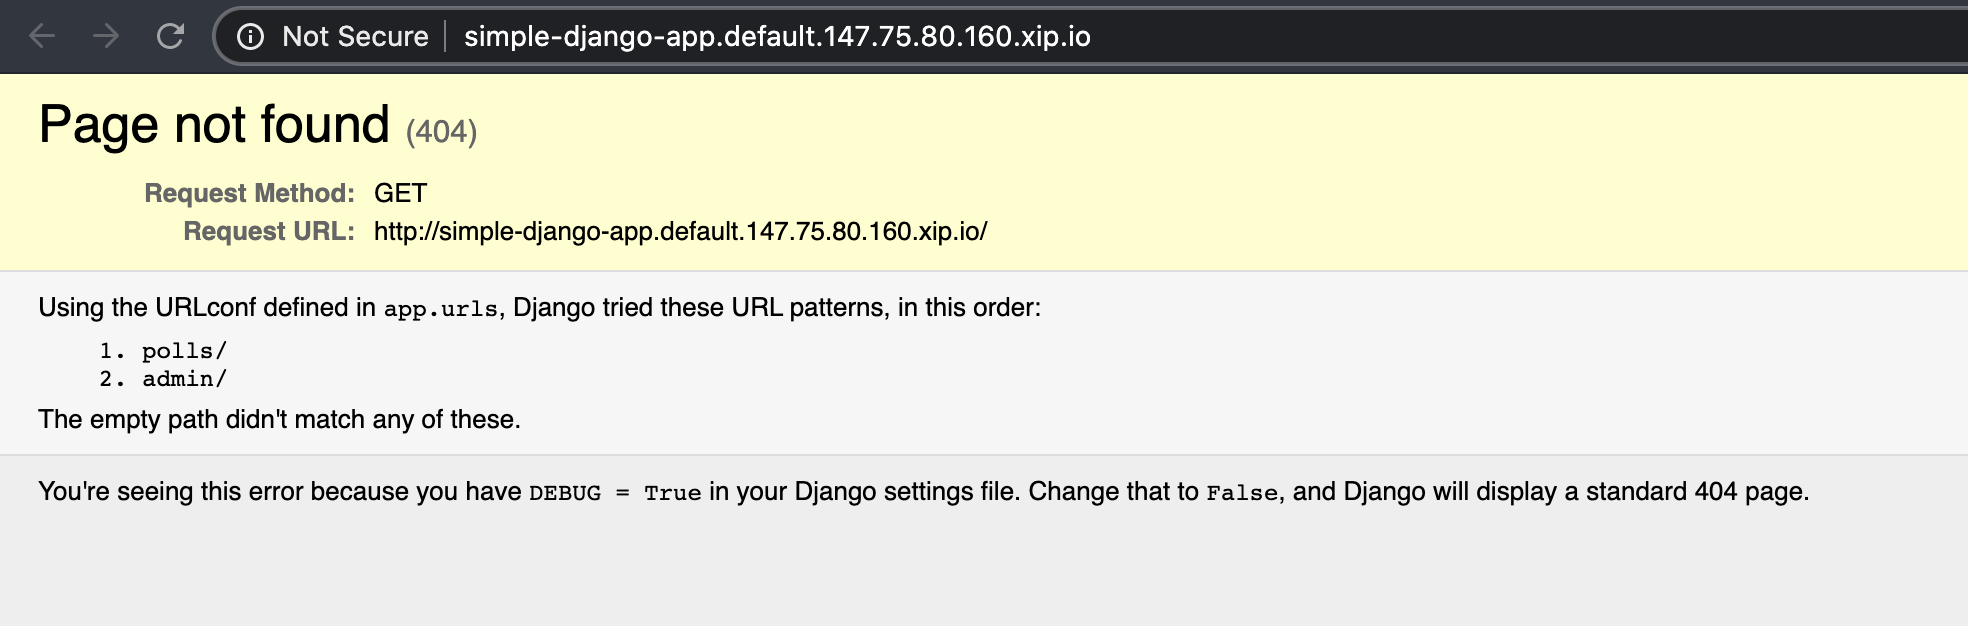
Now this…this is pretty damn cool! There’s no database and we still need to build our containers, but it looks pretty damn cool!
ElasticSearch and Kibana
Before we move further to test it more, let’s configure some observability tools, like ElasticSearch + Kibana for logs and Prometheus + Grafana for metrics.
Let’s start with the metrics component. We’ll follow the guide and we’ll just need to edit the config-observability config map. It already provides us with an config example, we’ll be using it. Just unindent the exemple, for now. Next, we’ll need to create the knative-monitoring namespace, and apply the manifests:
╰─>$ kubectl apply --filename https://storage.googleapis.com/knative-nightly/serving/latest/monitoring-metrics-prometheus.yaml
The pods should be up and running in the knative-monitoring namespace:
╰─>$ kubectl get pod -n knative-monitoring -o wide
NAME                                 READY   STATUS    RESTARTS   AGE    IP              NODE                   NOMINATED NODE   READINESS GATES
grafana-c9c94bdff-5f77v              1/1     Running   0          2m3s   10.233.65.210   rabbit-3.vtemian.com   <none>           <none>
kube-state-metrics-b6bcff8f4-tvp46   1/1     Running   0          2m7s   10.233.65.209   rabbit-3.vtemian.com   <none>           <none>
node-exporter-9wkpn                  2/2     Running   0          2m4s   10.80.204.131   rabbit-2.vtemian.com   <none>           <none>
node-exporter-lfjss                  2/2     Running   0          2m4s   10.80.204.129   rabbit-1.vtemian.com   <none>           <none>
node-exporter-zjl7b                  2/2     Running   0          2m4s   10.80.204.133   rabbit-3.vtemian.com   <none>           <none>
prometheus-system-0                  1/1     Running   0          2m1s   10.233.65.211   rabbit-3.vtemian.com   <none>           <none>
prometheus-system-1                  1/1     Running   0          2m1s   10.233.125.75   rabbit-2.vtemian.com   <none>           <none>
By default, Grafana comes with some really nice dashboards and with Prometheus configured as a data source. The only problem is that the Prometheus configured, is not the currently running service. We’ll need to get all currently running services and check Prometheus service name, which in this case is prometheus-system-discovery.
╰─>$ kubectl -n knative-monitoring get service
NAME                          TYPE        CLUSTER-IP      EXTERNAL-IP   PORT(S)             AGE
kube-controller-manager       ClusterIP   None            <none>        10252/TCP           5m36s
kube-state-metrics            ClusterIP   10.233.56.244   <none>        8080/TCP,8081/TCP   5m41s
node-exporter                 ClusterIP   None            <none>        9100/TCP            5m38s
prometheus-system-discovery   ClusterIP   None            <none>        9090/TCP            5m36s
We’ll have to edit Grafana’s config map and replace Prometheus’ URL with [http://prometheus-system-discovery.knative-monitoring.svc:9090](http://prometheus-system-discovery.knative-monitoring.svc:9090/).
╰─>$ kubectl -n knative-monitoring edit cm grafana-datasources
apiVersion: v1
data:
  prometheus.yaml: |
    datasources:
     - name: prometheus
       type: prometheus
       access: proxy
       org_id: 1
       url: http://prometheus-system-discovery.knative-monitoring.svc:9090
       version: 1
       editable: false
Delete the current running Grafana pod
╰─>$ kubectl delete po -n knative-monitoring --selector=app=grafana
pod "grafana-c9c94bdff-rkvrg" deleted
Wait until a new pod is started and you can port-forward it
╰─>$ kubectl port-forward --namespace knative-monitoring \
     (kubectl get pods --namespace knative-monitoring \
     --selector=app=grafana --output=jsonpath="{.items..metadata.name}") \
     3000
Forwarding from 127.0.0.1:3000 -> 3000
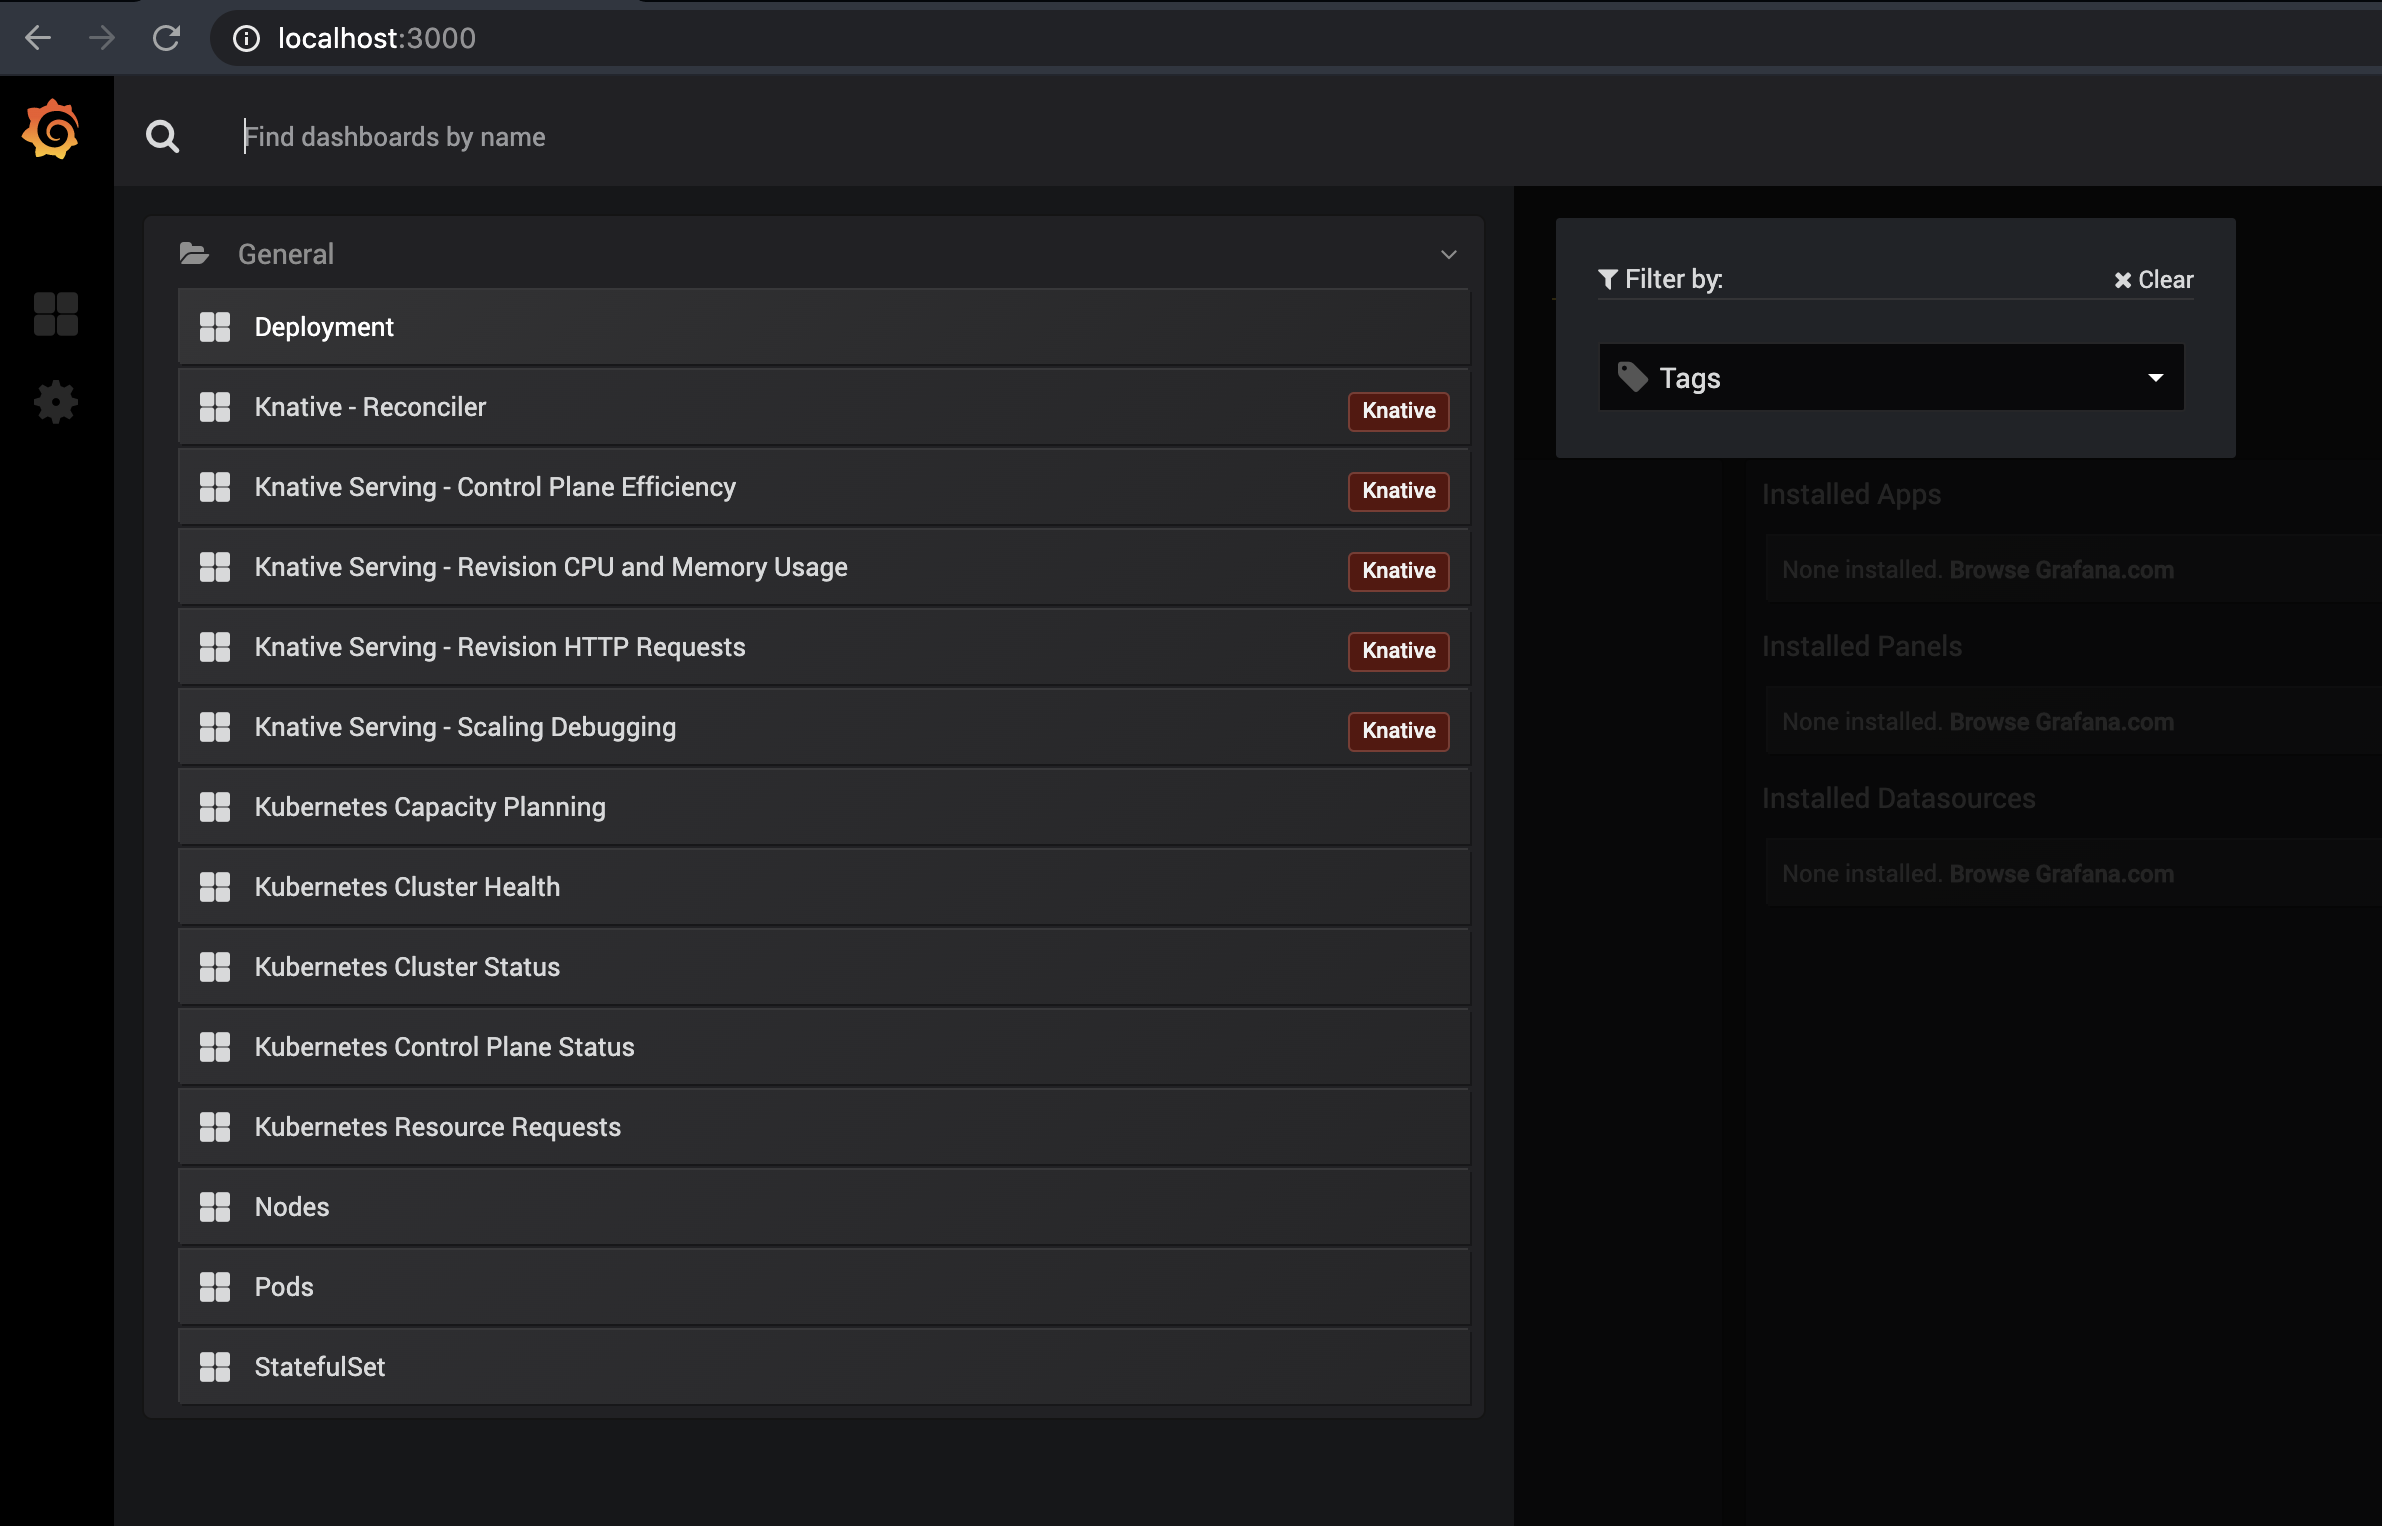
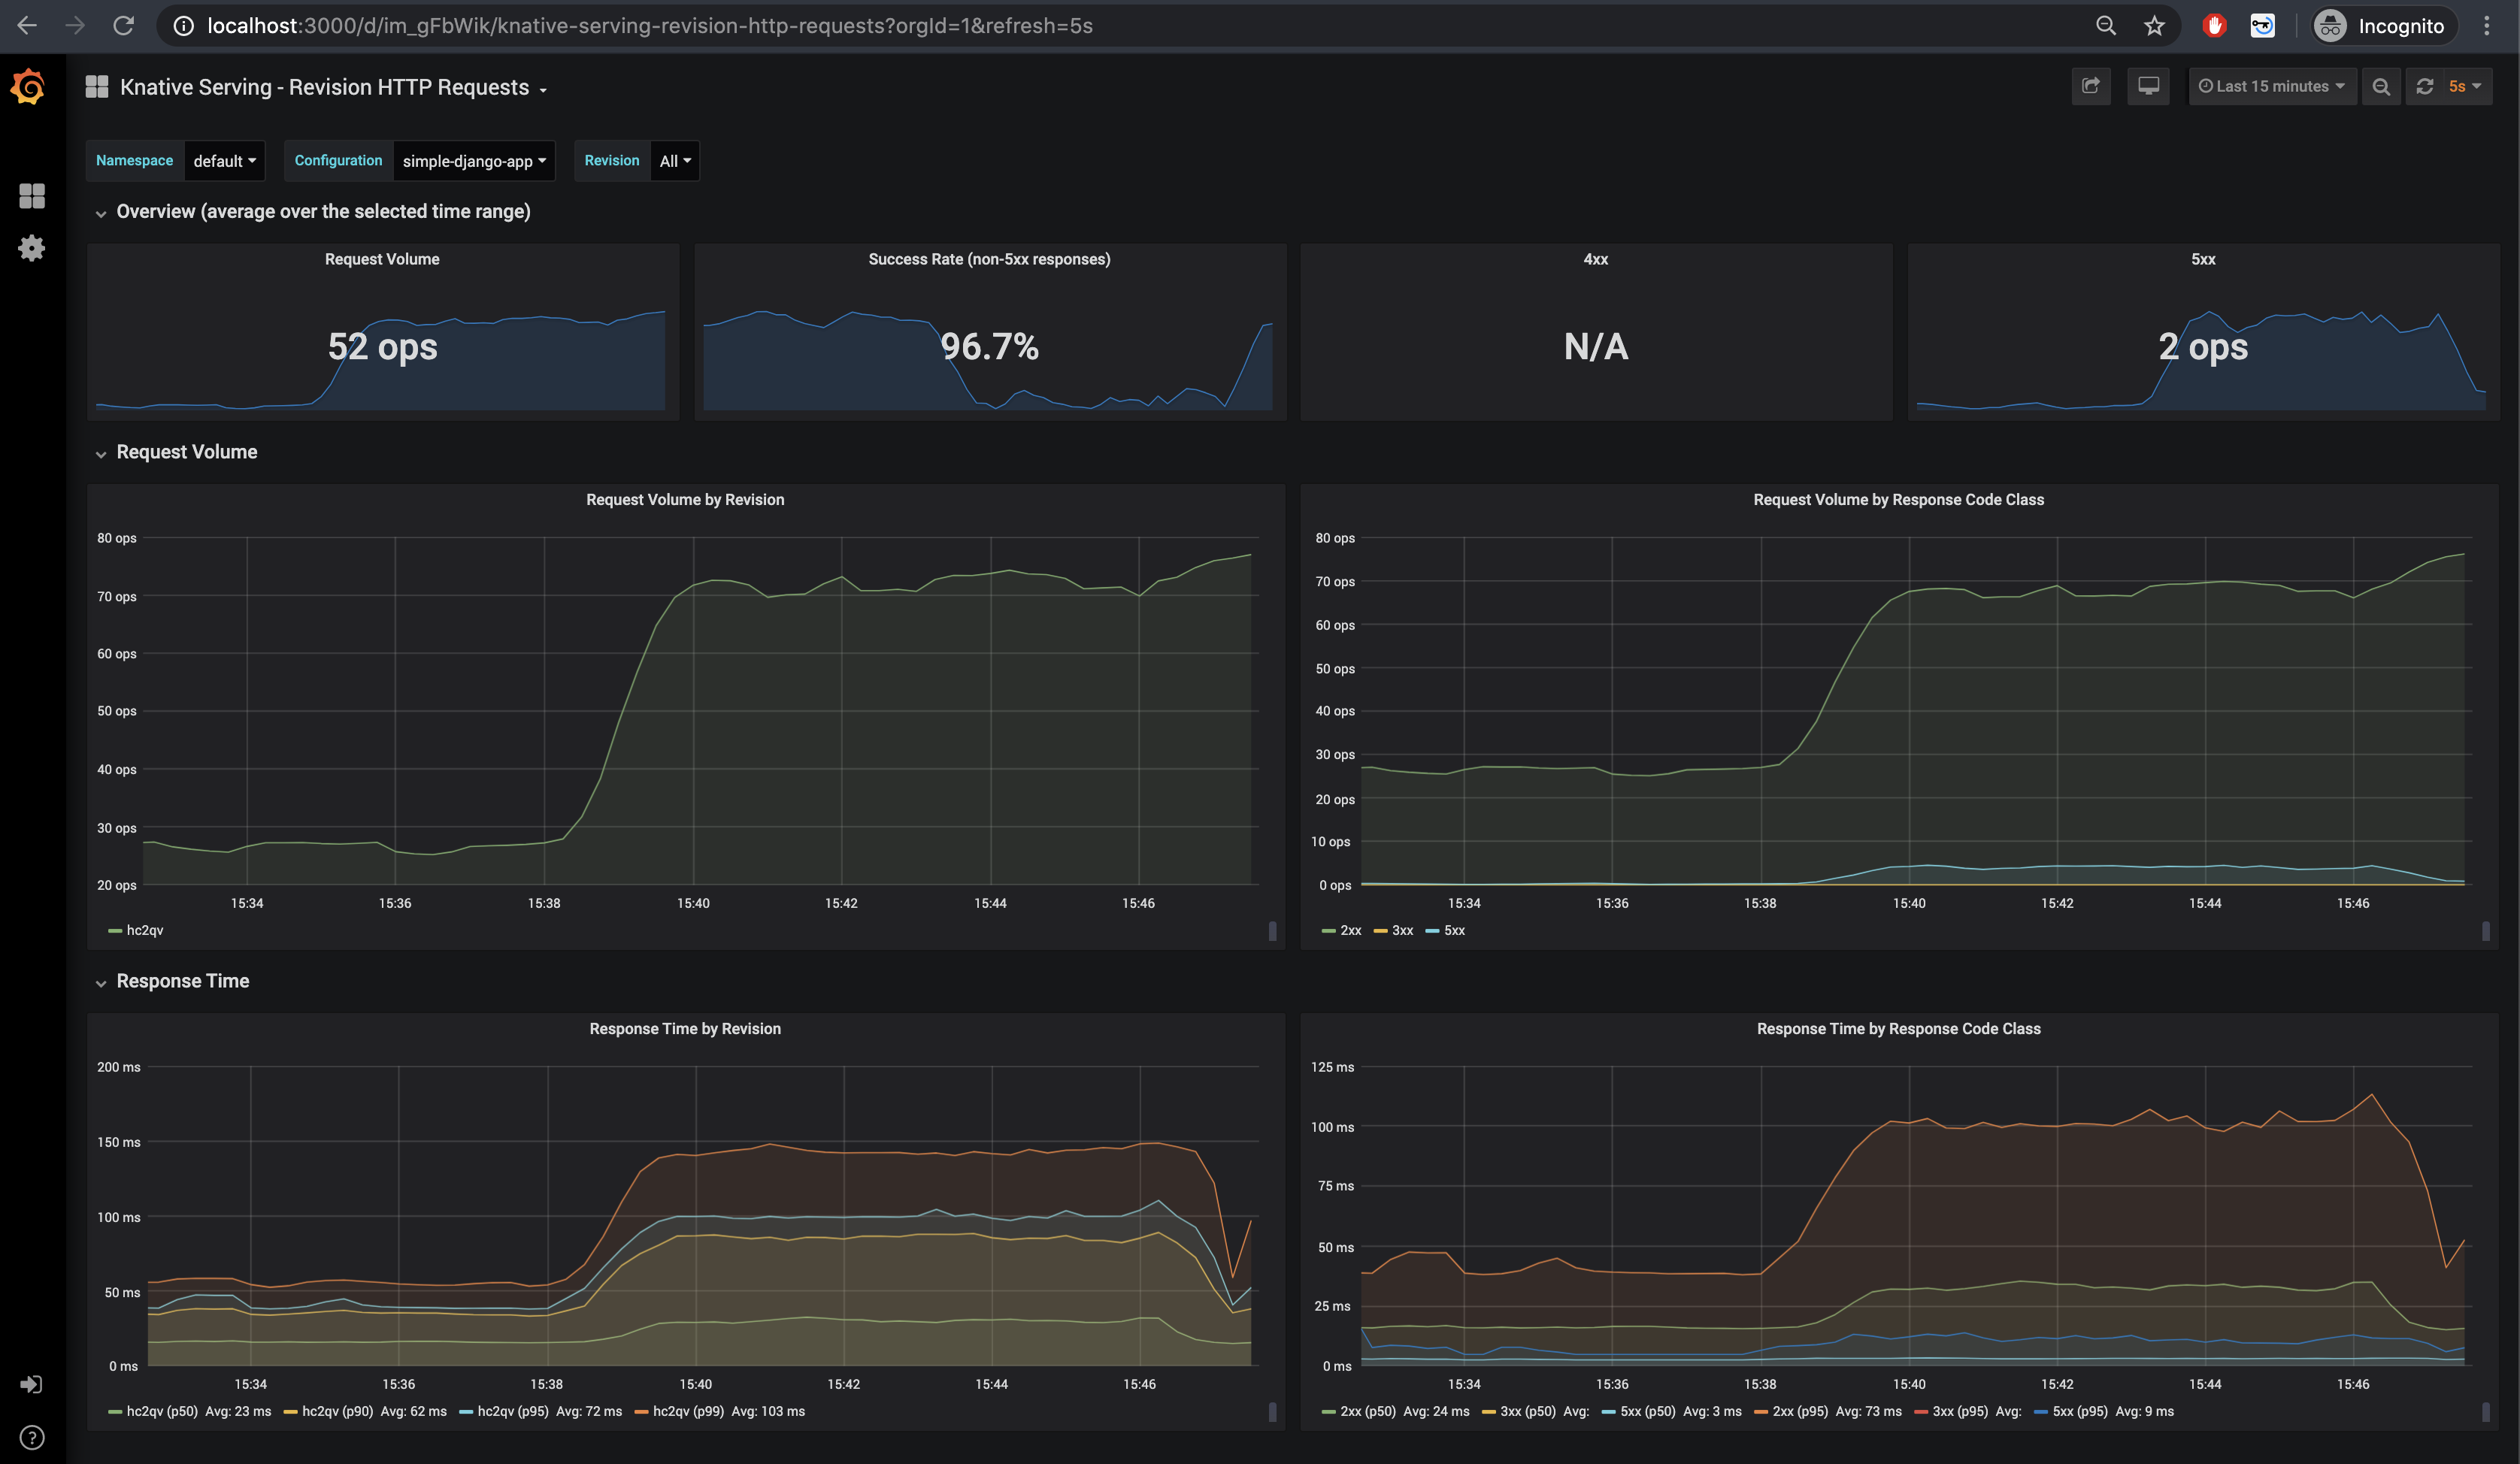
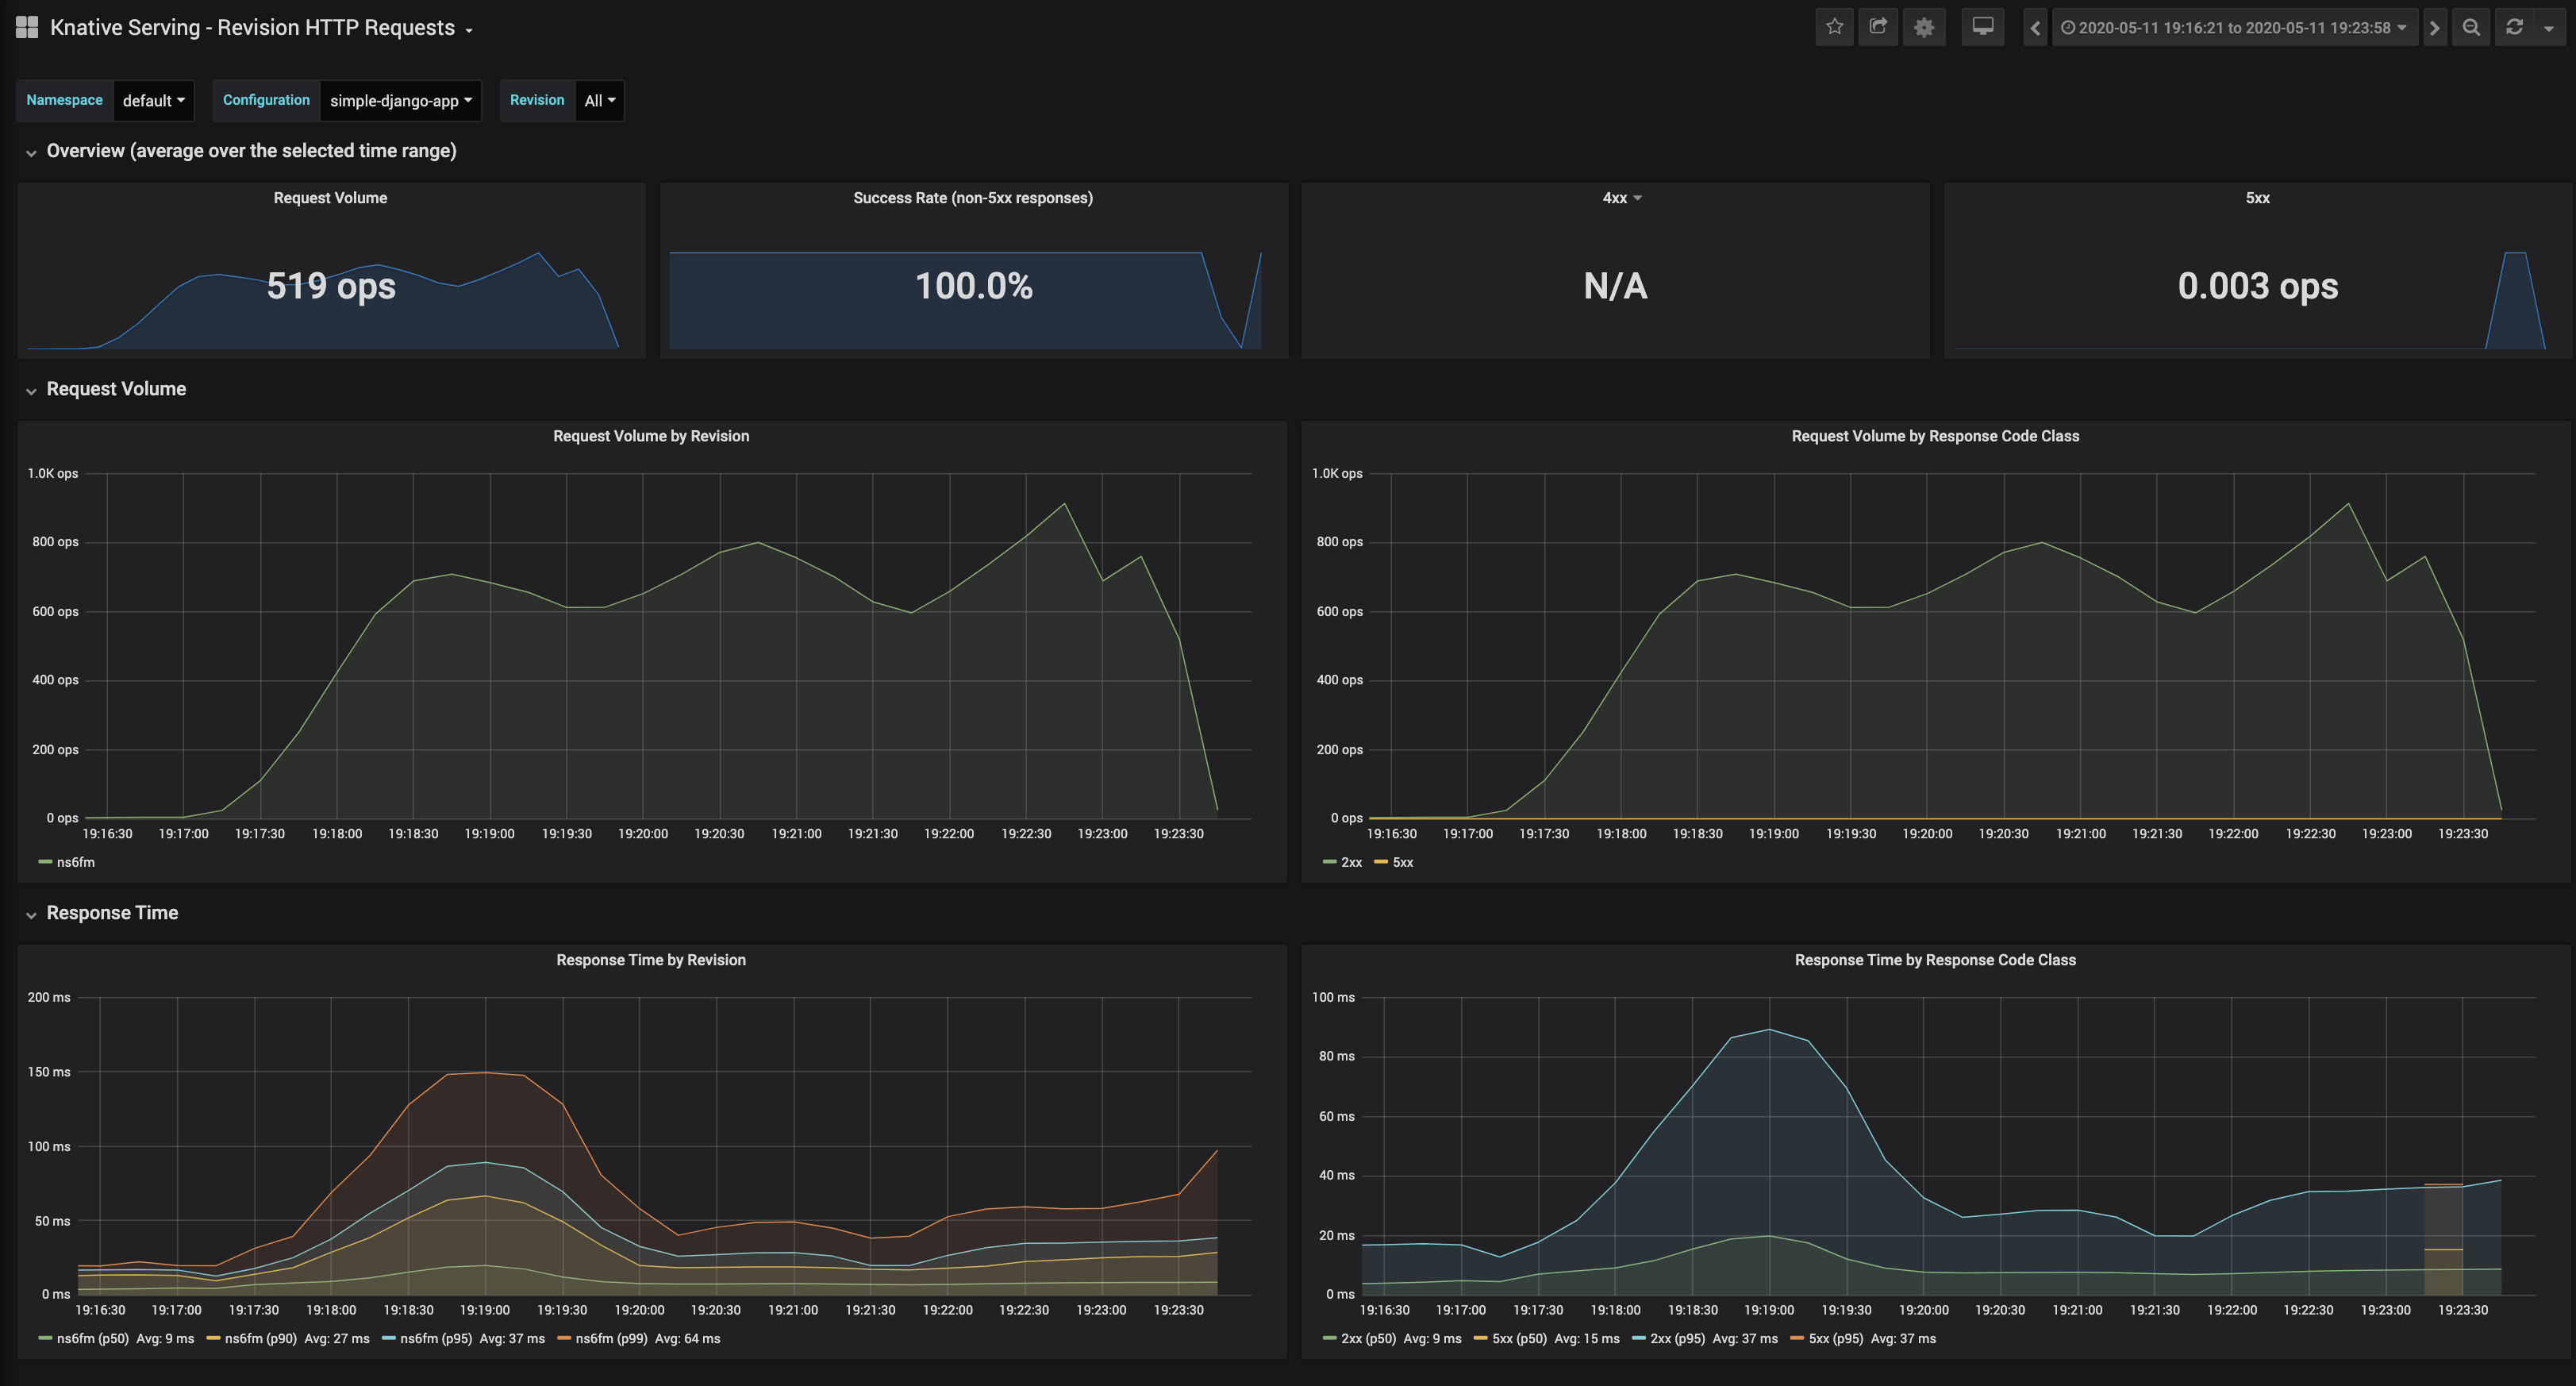
All of those default dashboards are interesting, but I found the most useful the Knative Serving - Revision HTTP Requests, that describes current running applications.
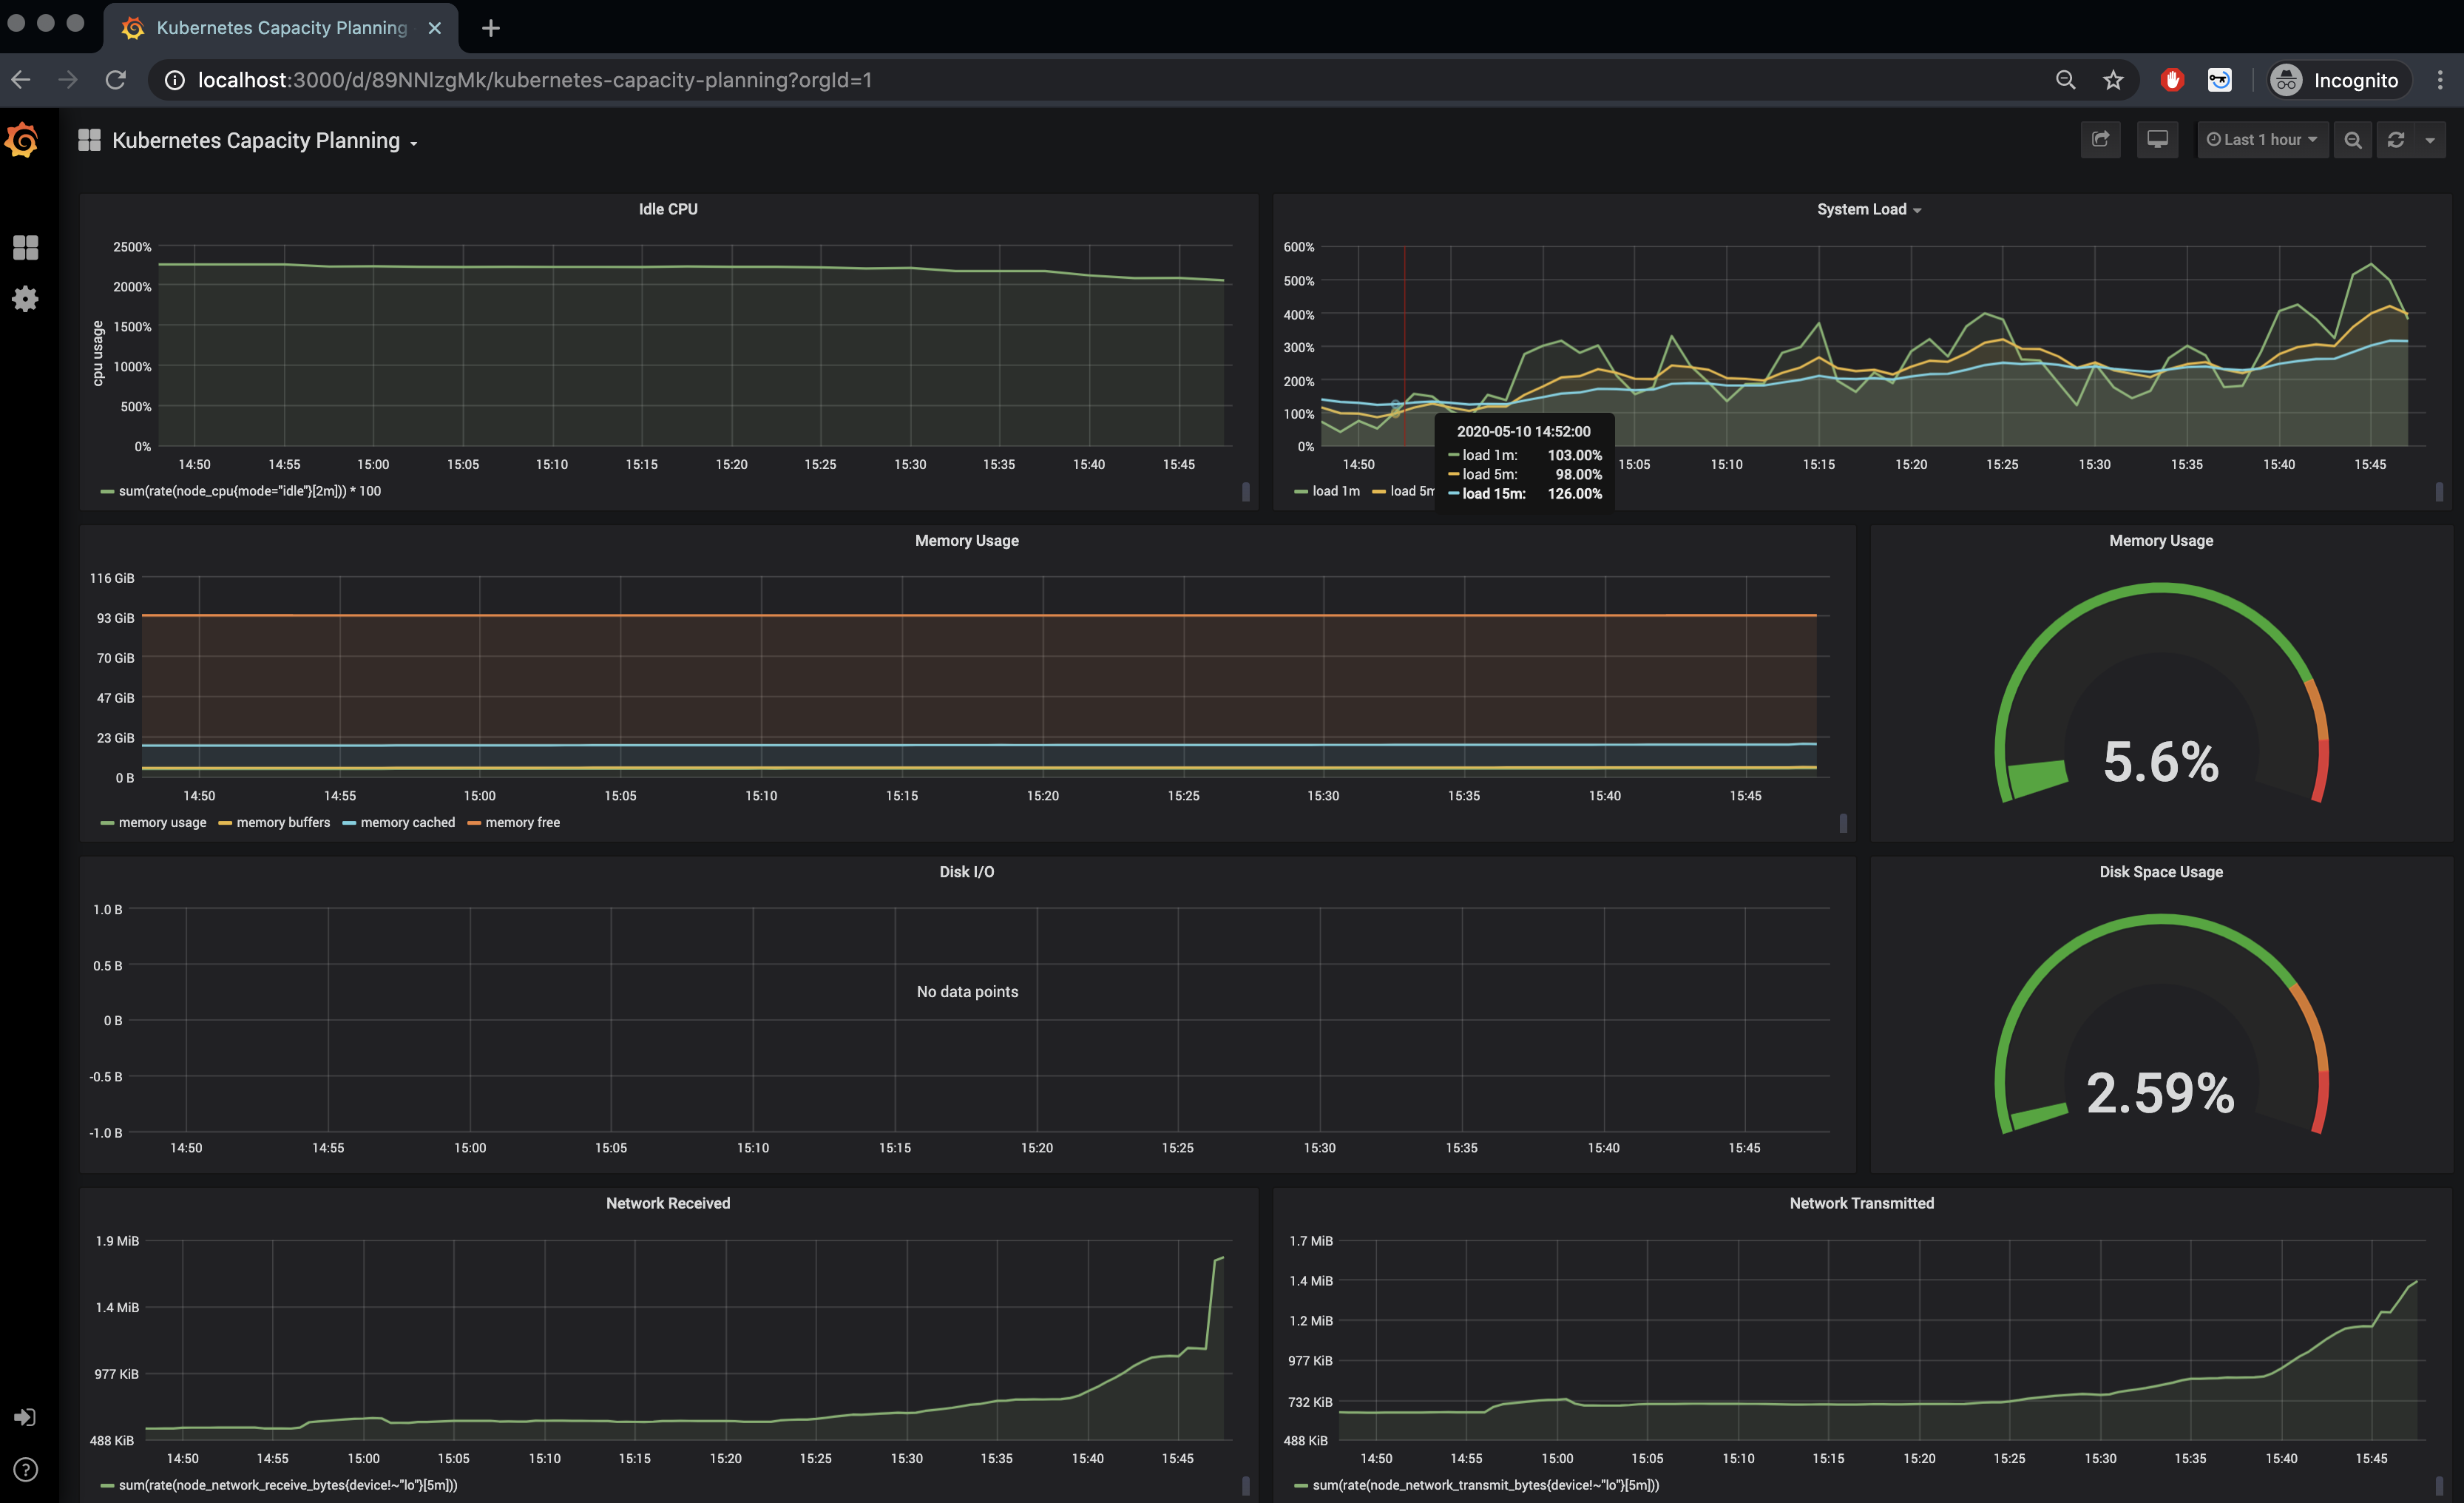
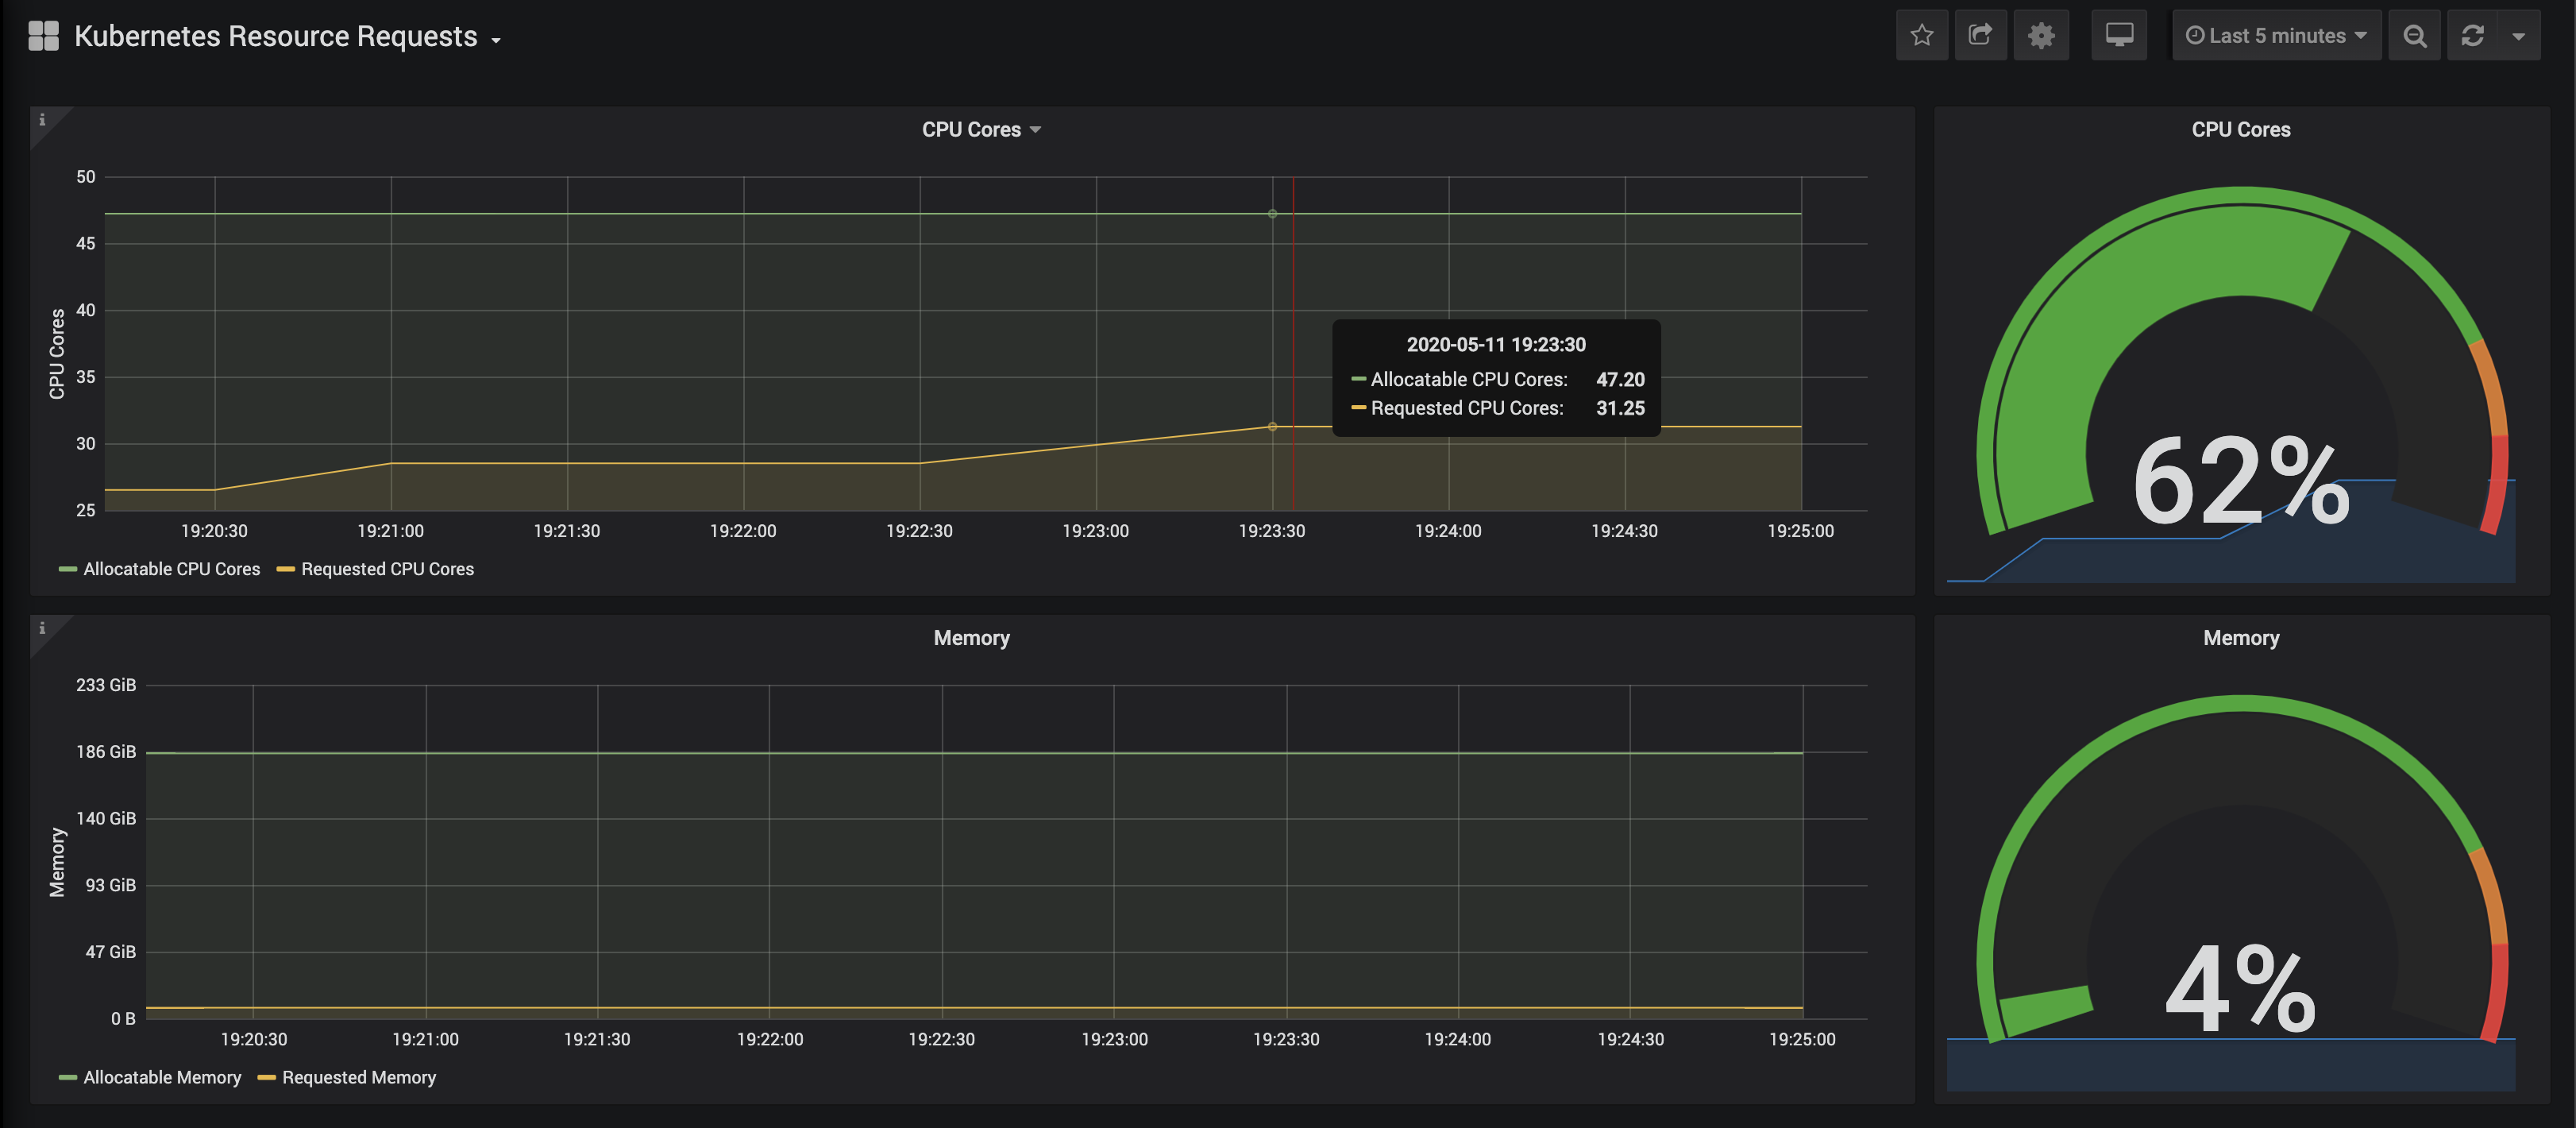
And the Kubernetes Capacity Planning that gives an overview over the entire cluster.
Moving to logs, we’ll need to configure ElasticSearch and Kibana. We’ll need to edit the config-observability ConfigMap and set the logging.request-log-template to
╰─>$ kubectl edit cm config-observability
logging.request-log-template: '{"httpRequest": {"requestMethod": "{{.Request.Method}}", "requestUrl": "{{js .Request.RequestURI}}", "requestSize": "{{.Request.ContentLength}}", "status": {{.Response.Code}}, "responseSize": "{{.Response.Size}}", "userAgent": "{{js .Request.UserAgent}}", "remoteIp": "{{js .Request.RemoteAddr}}", "serverIp": "{{.Revision.PodIP}}", "referer": "{{js .Request.Referer}}", "latency": "{{.Response.Latency}}s", "protocol": "{{.Request.Proto}}"}, "traceId": "{{index .Request.Header "X-B3-Traceid"}}"}'
Apply the manifest
╰─>$ kubectl apply --filename https://storage.googleapis.com/knative-nightly/serving/latest/monitoring-logs-elasticsearch.yaml
We’ll set [beta.kubernetes.io/fluentd-ds-ready="true"](http://beta.kubernetes.io/fluentd-ds-ready=%22true%22) label for our nodes
╰─>$ kubectl label nodes --all beta.kubernetes.io/fluentd-ds-ready="true"
node/rabbit-1.vtemian.com labeled
node/rabbit-2.vtemian.com labeled
node/rabbit-3.vtemian.com labeled
And check if the fluentd daemon set is running on our nodes
╰─>$ kubectl get daemonset fluentd-ds --namespace knative-monitoring
NAME         DESIRED   CURRENT   READY   UP-TO-DATE   AVAILABLE   NODE SELECTOR                              AGE
fluentd-ds   2         2         2       2            2           beta.kubernetes.io/fluentd-ds-ready=true   5m37s
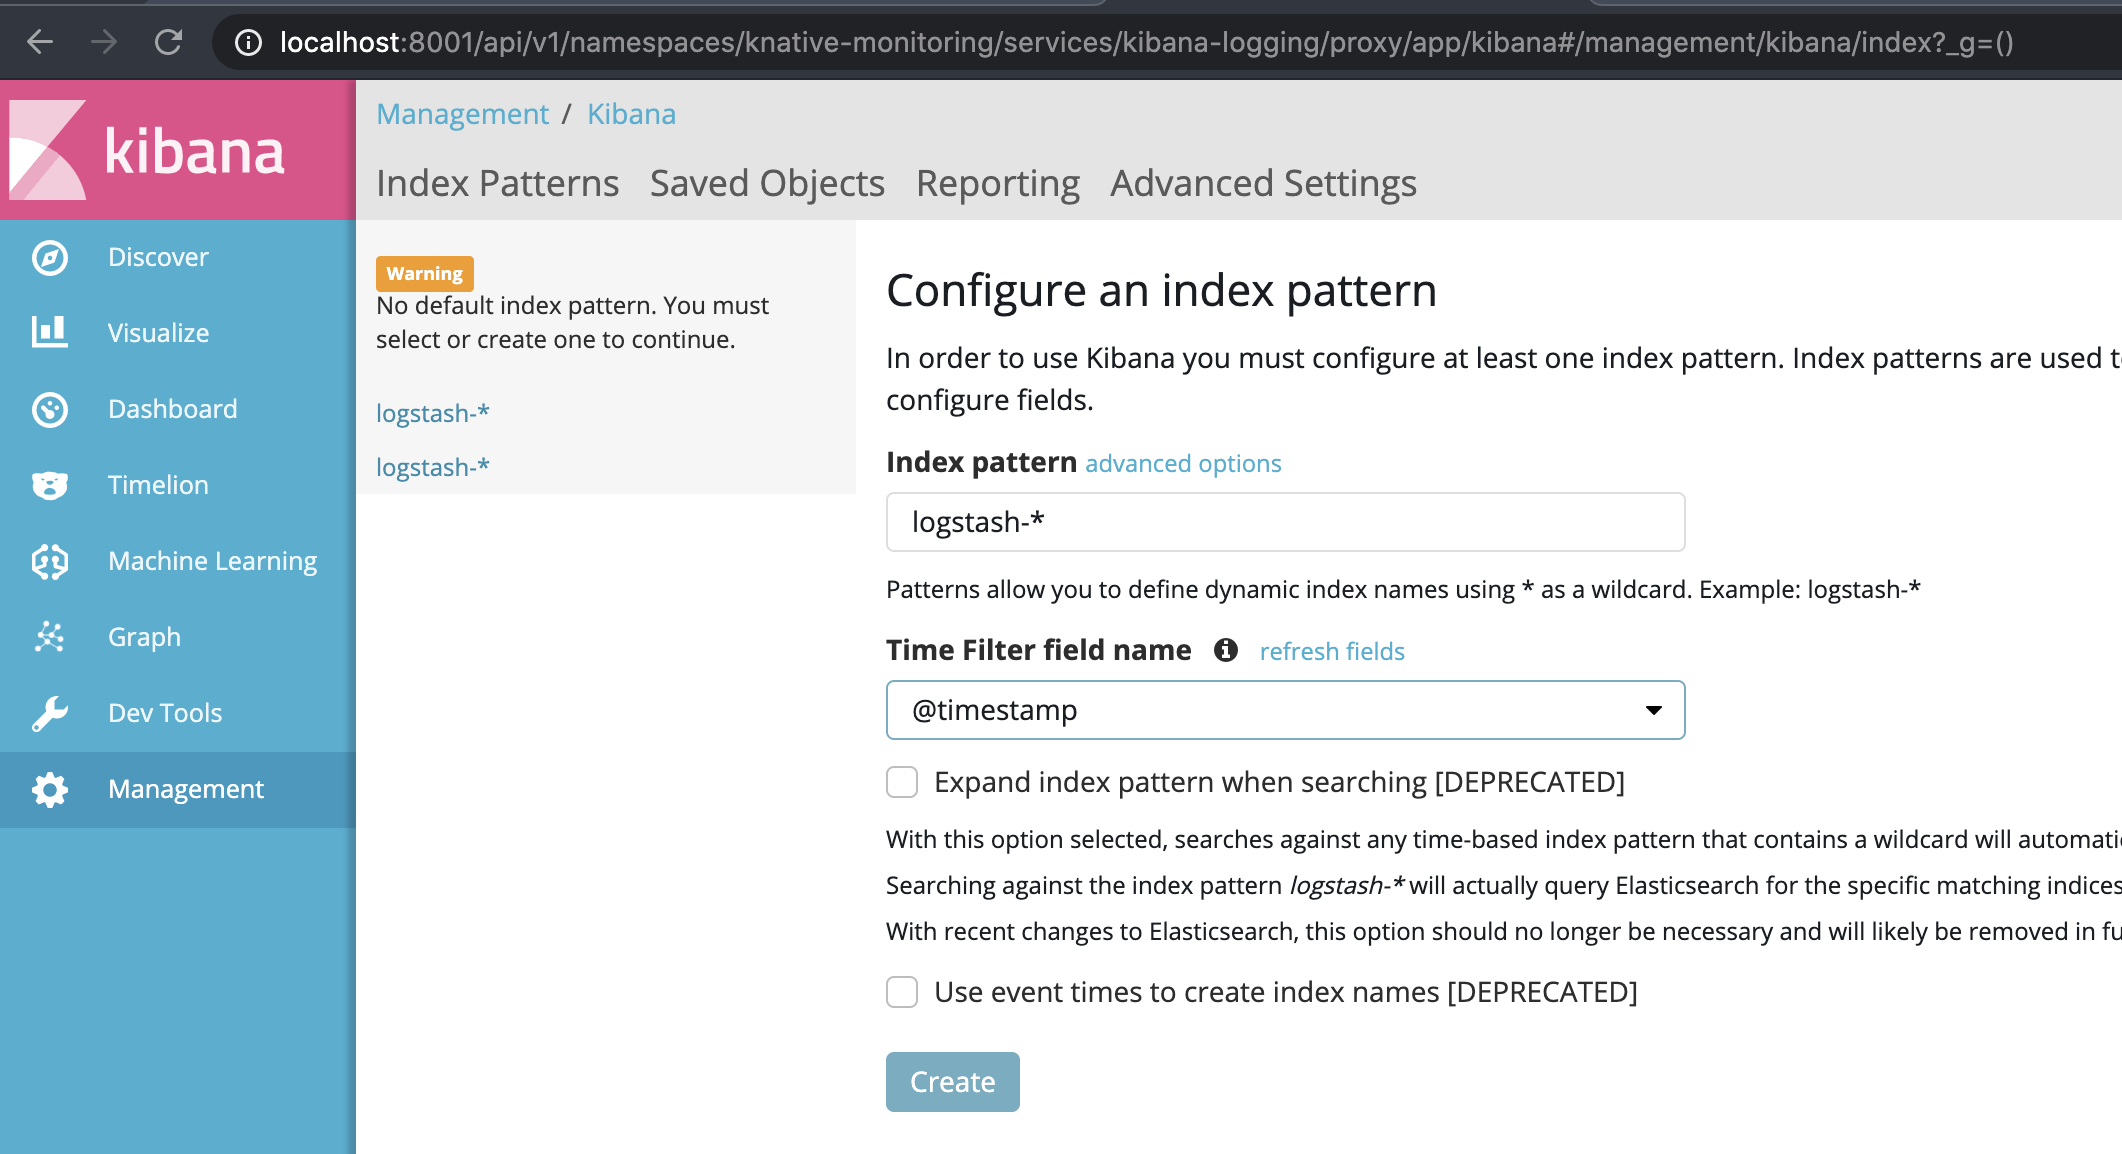
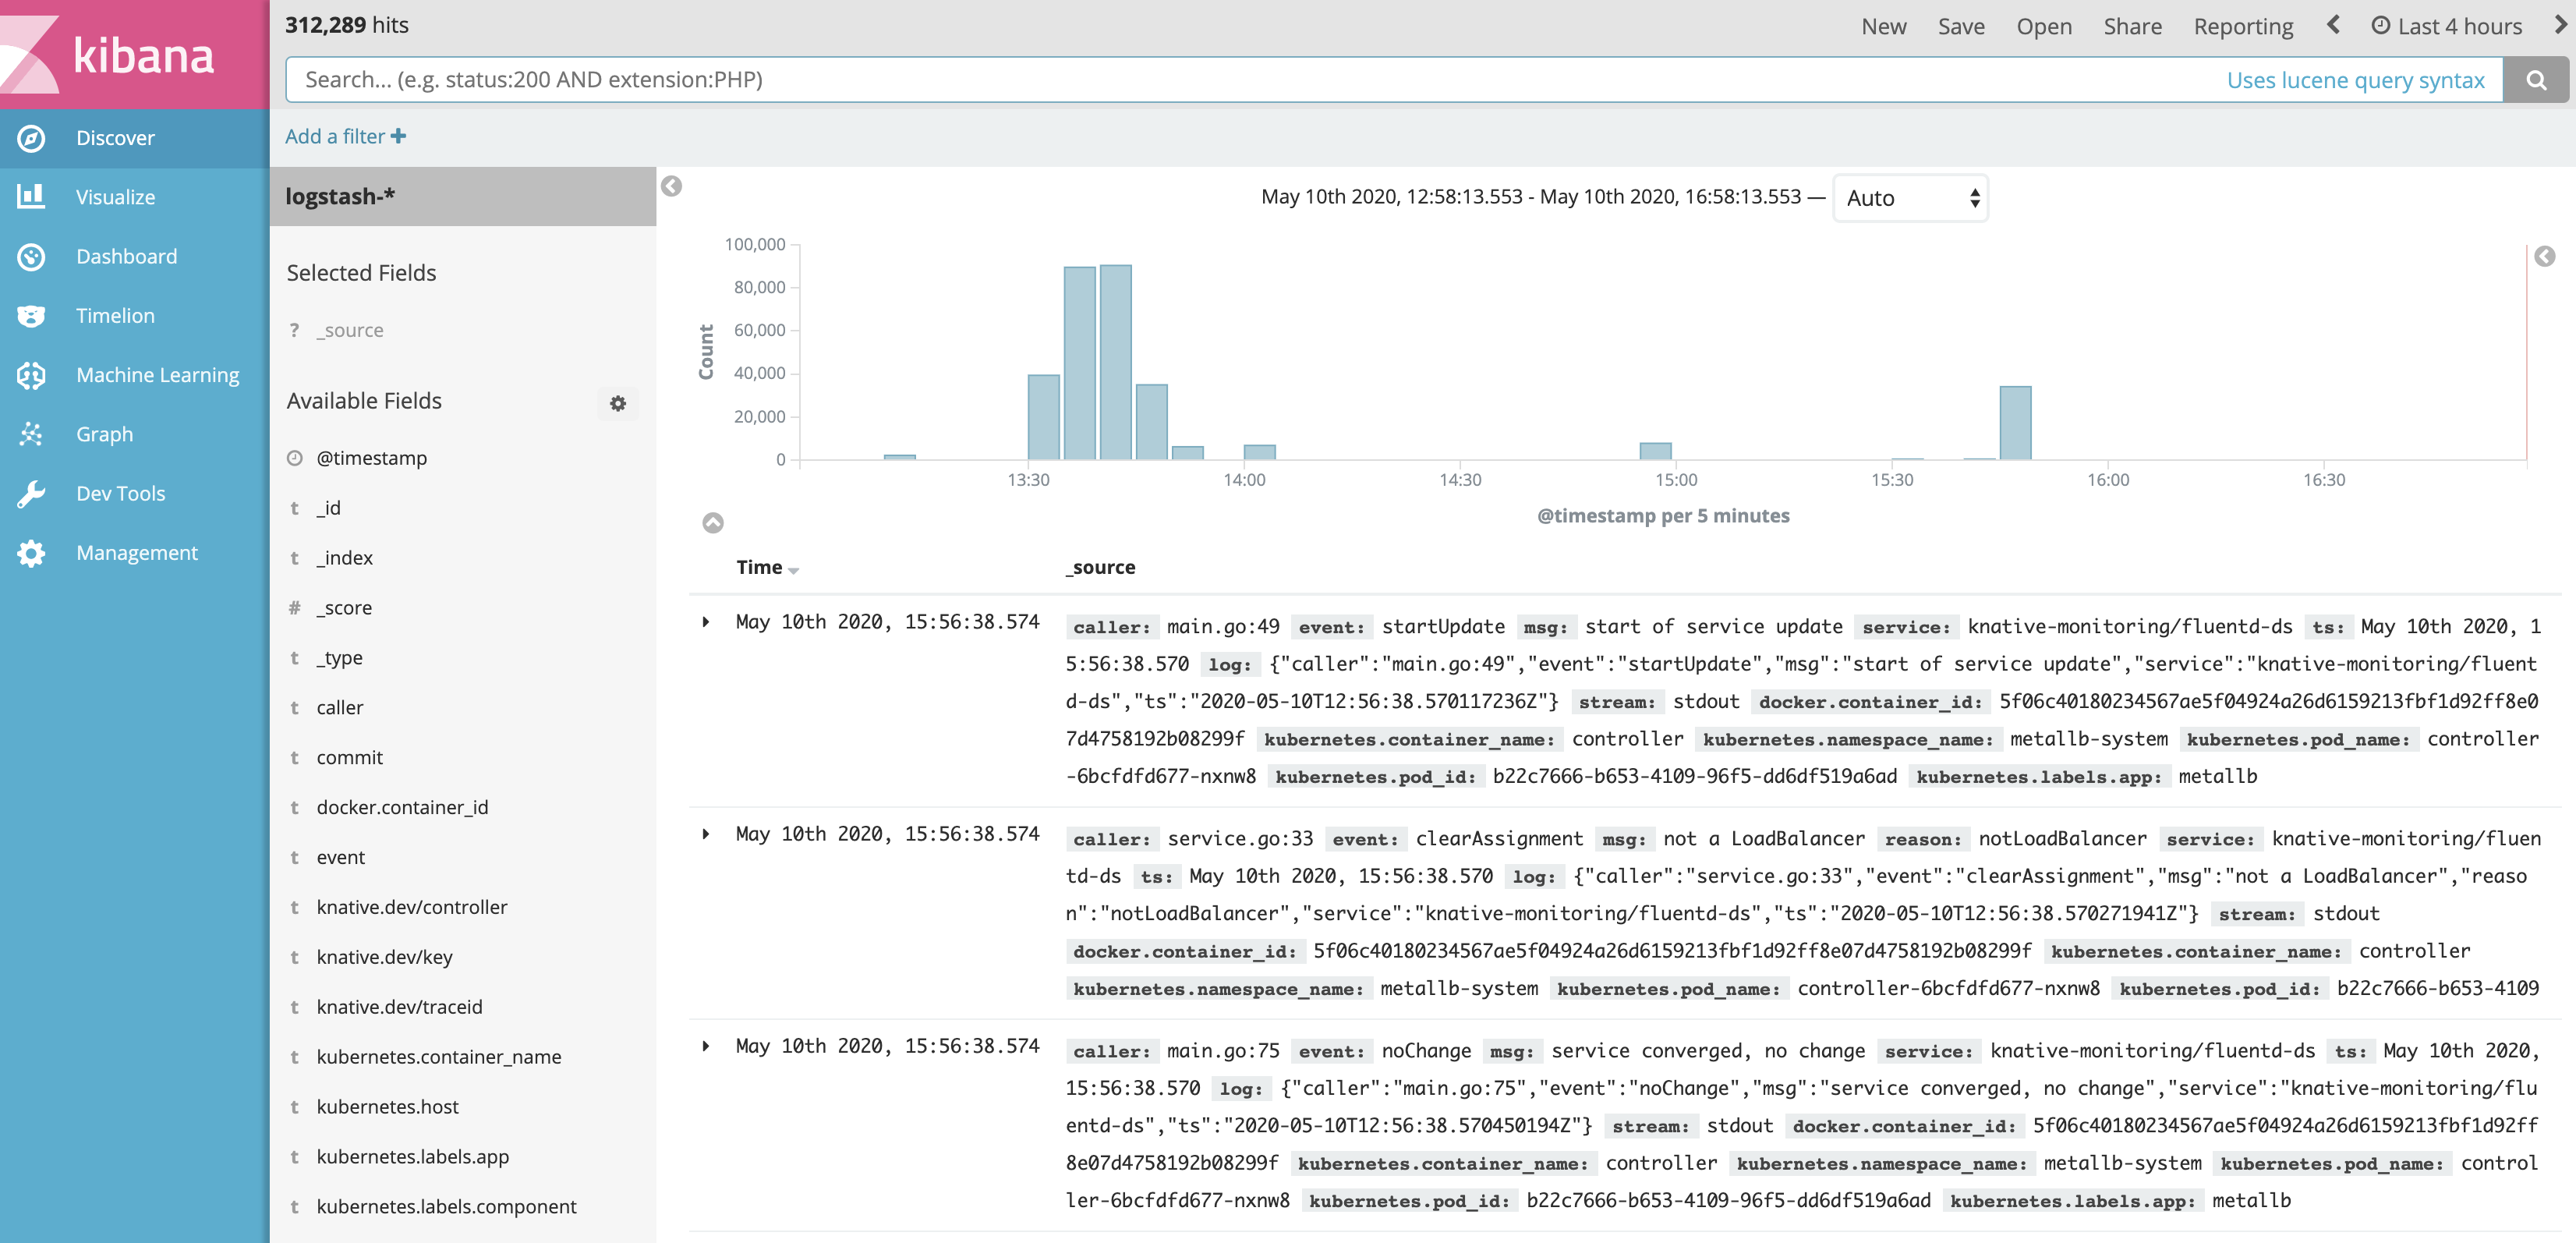
In this point, on each node a Fluentd daemon is running, collecting logs and send them to ElasticSearch. Furthermore, we’ll need to configure Kibana to access those logs.
We’ll start the local proxy
╰─>$kubectl proxy
And visit Kibana UI. If the service doesn’t start, you can create one with the following configuration
apiVersion: v1
kind: Service
metadata:
  name: kibana-logging
  namespace: knative-monitoring
  labels:
    app: kibana-logging
    kubernetes.io/cluster-service: "true"
    kubernetes.io/name: "Kibana"
spec:
  ports:
  - port: 5601
    protocol: TCP
    targetPort: ui
  selector:
    app: kibana-logging
Create a new index and wait until is processed.
Set it as the default index
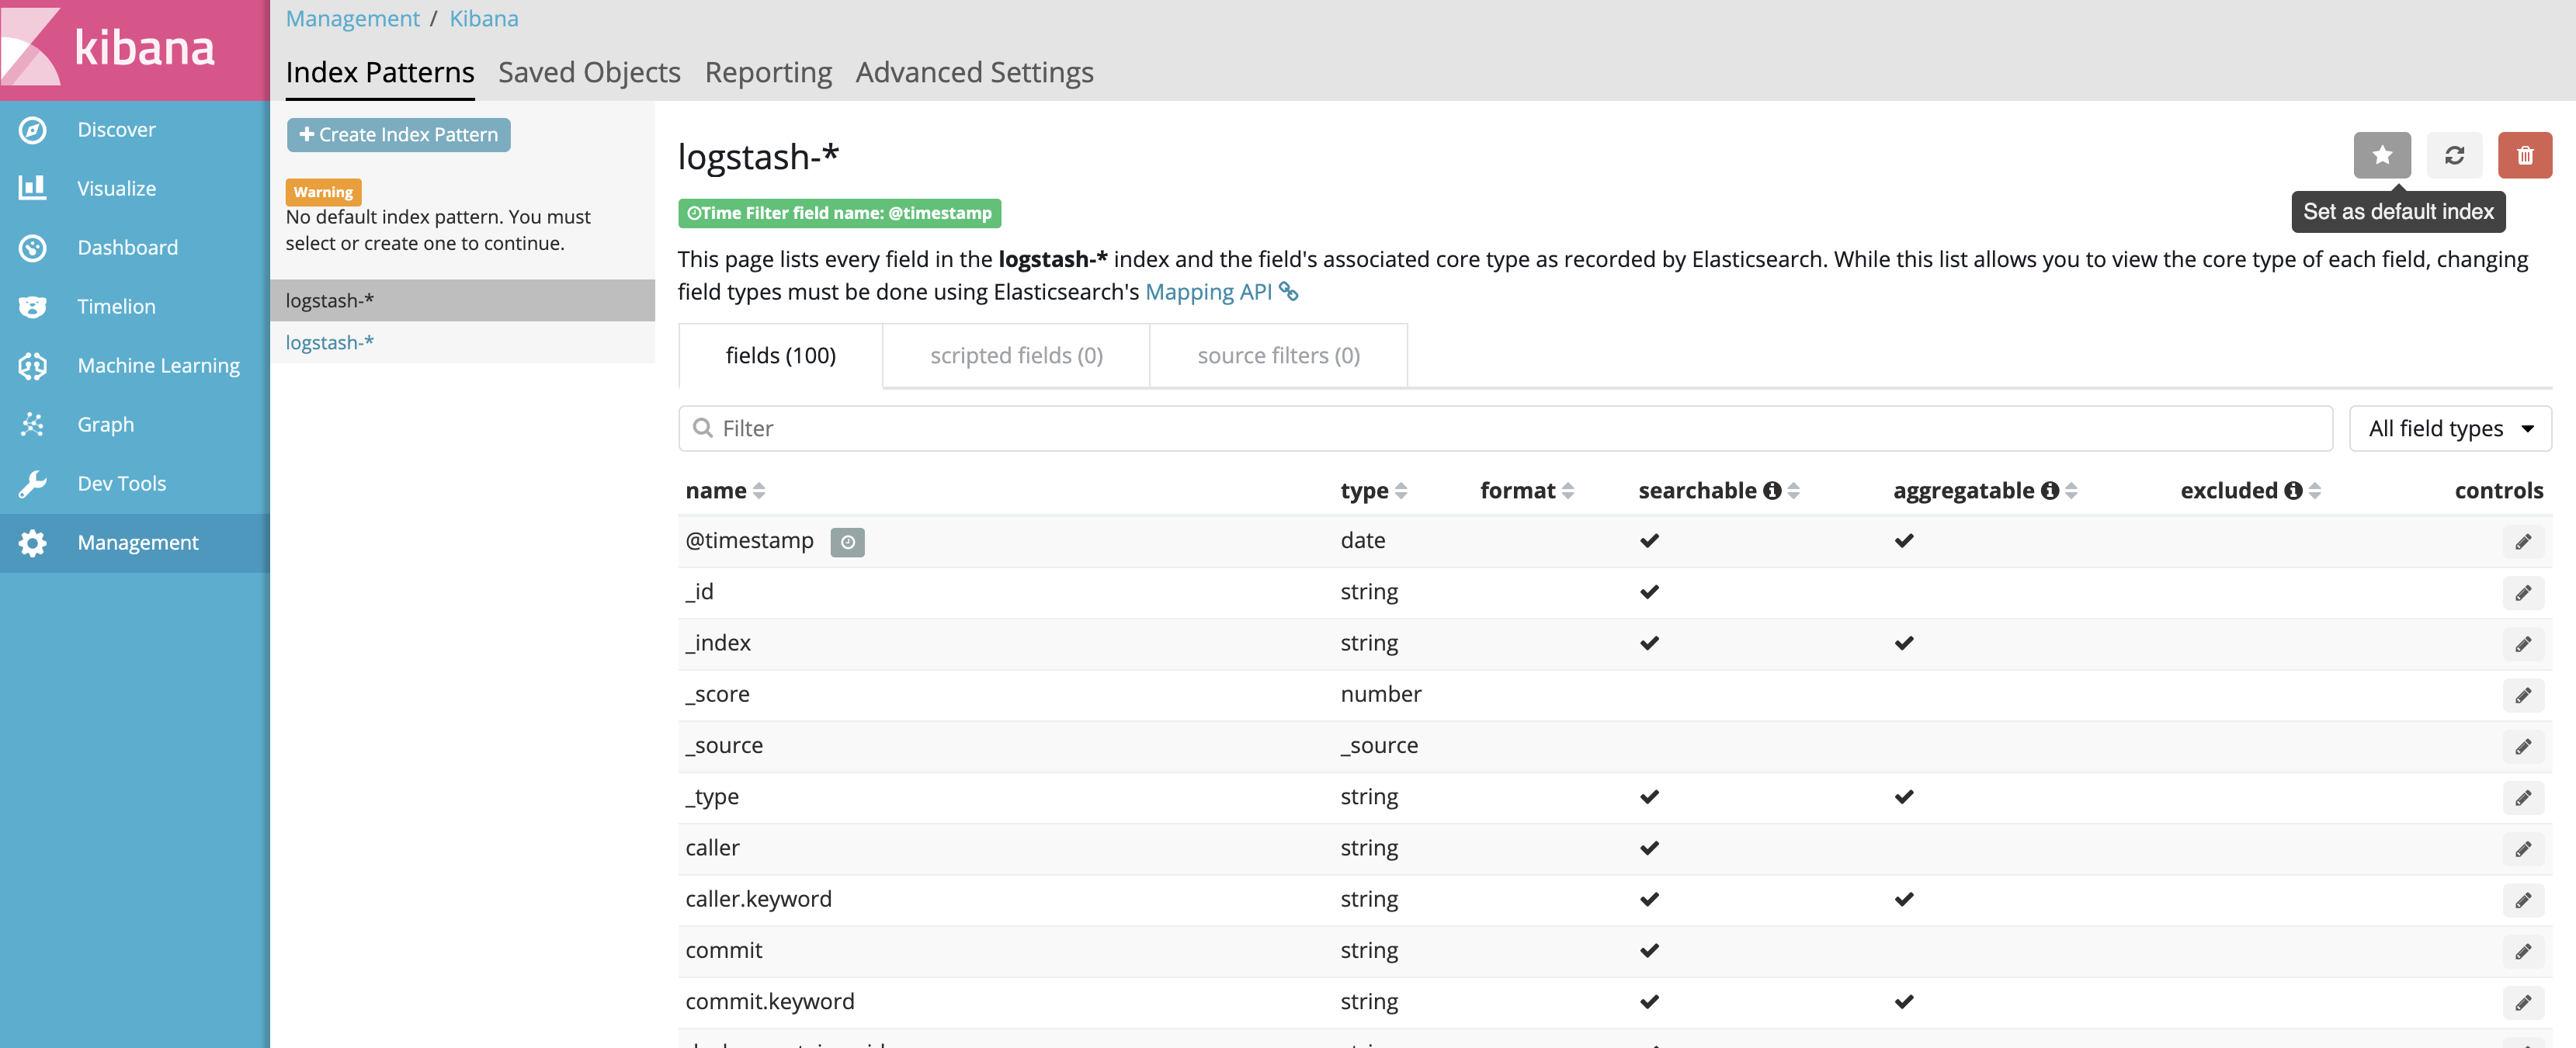
And the logs should flow
Autoscaling
Now that we can really see what is happening in the cluster, let’s configure the autoscaling and 0 scaling. For that, we’ll need to edit the config-autoscaler ConfigMap. All options are already described in the comments, and for testing purpose, this is the configuration I’m using:
  activator-capacity: "100.0"
  container-concurrency-target-default: "100"
  container-concurrency-target-percentage: "70"
  enable-graceful-scaledown: "true"
  enable-scale-to-zero: "true"
  max-scale-down-rate: "2.0"
  max-scale-up-rate: "1000.0"
  panic-threshold-percentage: "20.0"
  panic-window-percentage: "5.0"
  pod-autoscaler-class: kpa.autoscaling.knative.dev
  requests-per-second-target-default: "20"
  scale-to-zero-grace-period: 30s
  stable-window: 60s
  target-burst-capacity: "10"
  tick-interval: 2s
All those options are explained in the docs, but maybe what we’re most interested are the 0 scaling
# specifies the time an inactive revision is left running before it is scaled to zero (min: 6s).
scale-to-zero-grace-period: 30s
# enables scale to zero
enable-scale-to-zero: "true"
And the autoscaling trasholds
# defines how many concurrent requests are wanted at a given time (soft limit) and is the recommended configuration for autoscaling.
container-concurrency-target-default: "100"
Those are the configuration applied for each revision, but you can control independently, using annotations. Let’s configure the Horizontal Pod Autoscaler to follow the CPU metric and scale if the current consumed CPU is 30% of the limit.
apiVersion: serving.knative.dev/v1
kind: Service
metadata:
  name: simple-django-app
  namespace: default
spec:
  template:
    metadata:
      annotations:
        autoscaling.knative.dev/metric: cpu
        autoscaling.knative.dev/target: "70"
        autoscaling.knative.dev/class: hpa.autoscaling.knative.dev
    spec:
      containers:
      - image: docker.io/vtemian/simple-django-app
        resources:
          requests:
            cpu: 100m
Let’s start a curl in background
╰─>$ watch -n 0.1 curl -SI http://simple-django-app.default.147.75.80.160.xip.io/polls/
And we have 2 running pods
╰─>$ kubectl get po -l serving.knative.dev/service=simple-django-app
NAME                                                  READY   STATUS    RESTARTS   AGE
simple-django-app-g9zf5-deployment-5b76fdf7fc-mtlwt   2/2     Running   0          3m25s
simple-django-app-mg96q-deployment-7db5bb6b9c-29ffw   2/2     Running   0          4m18s
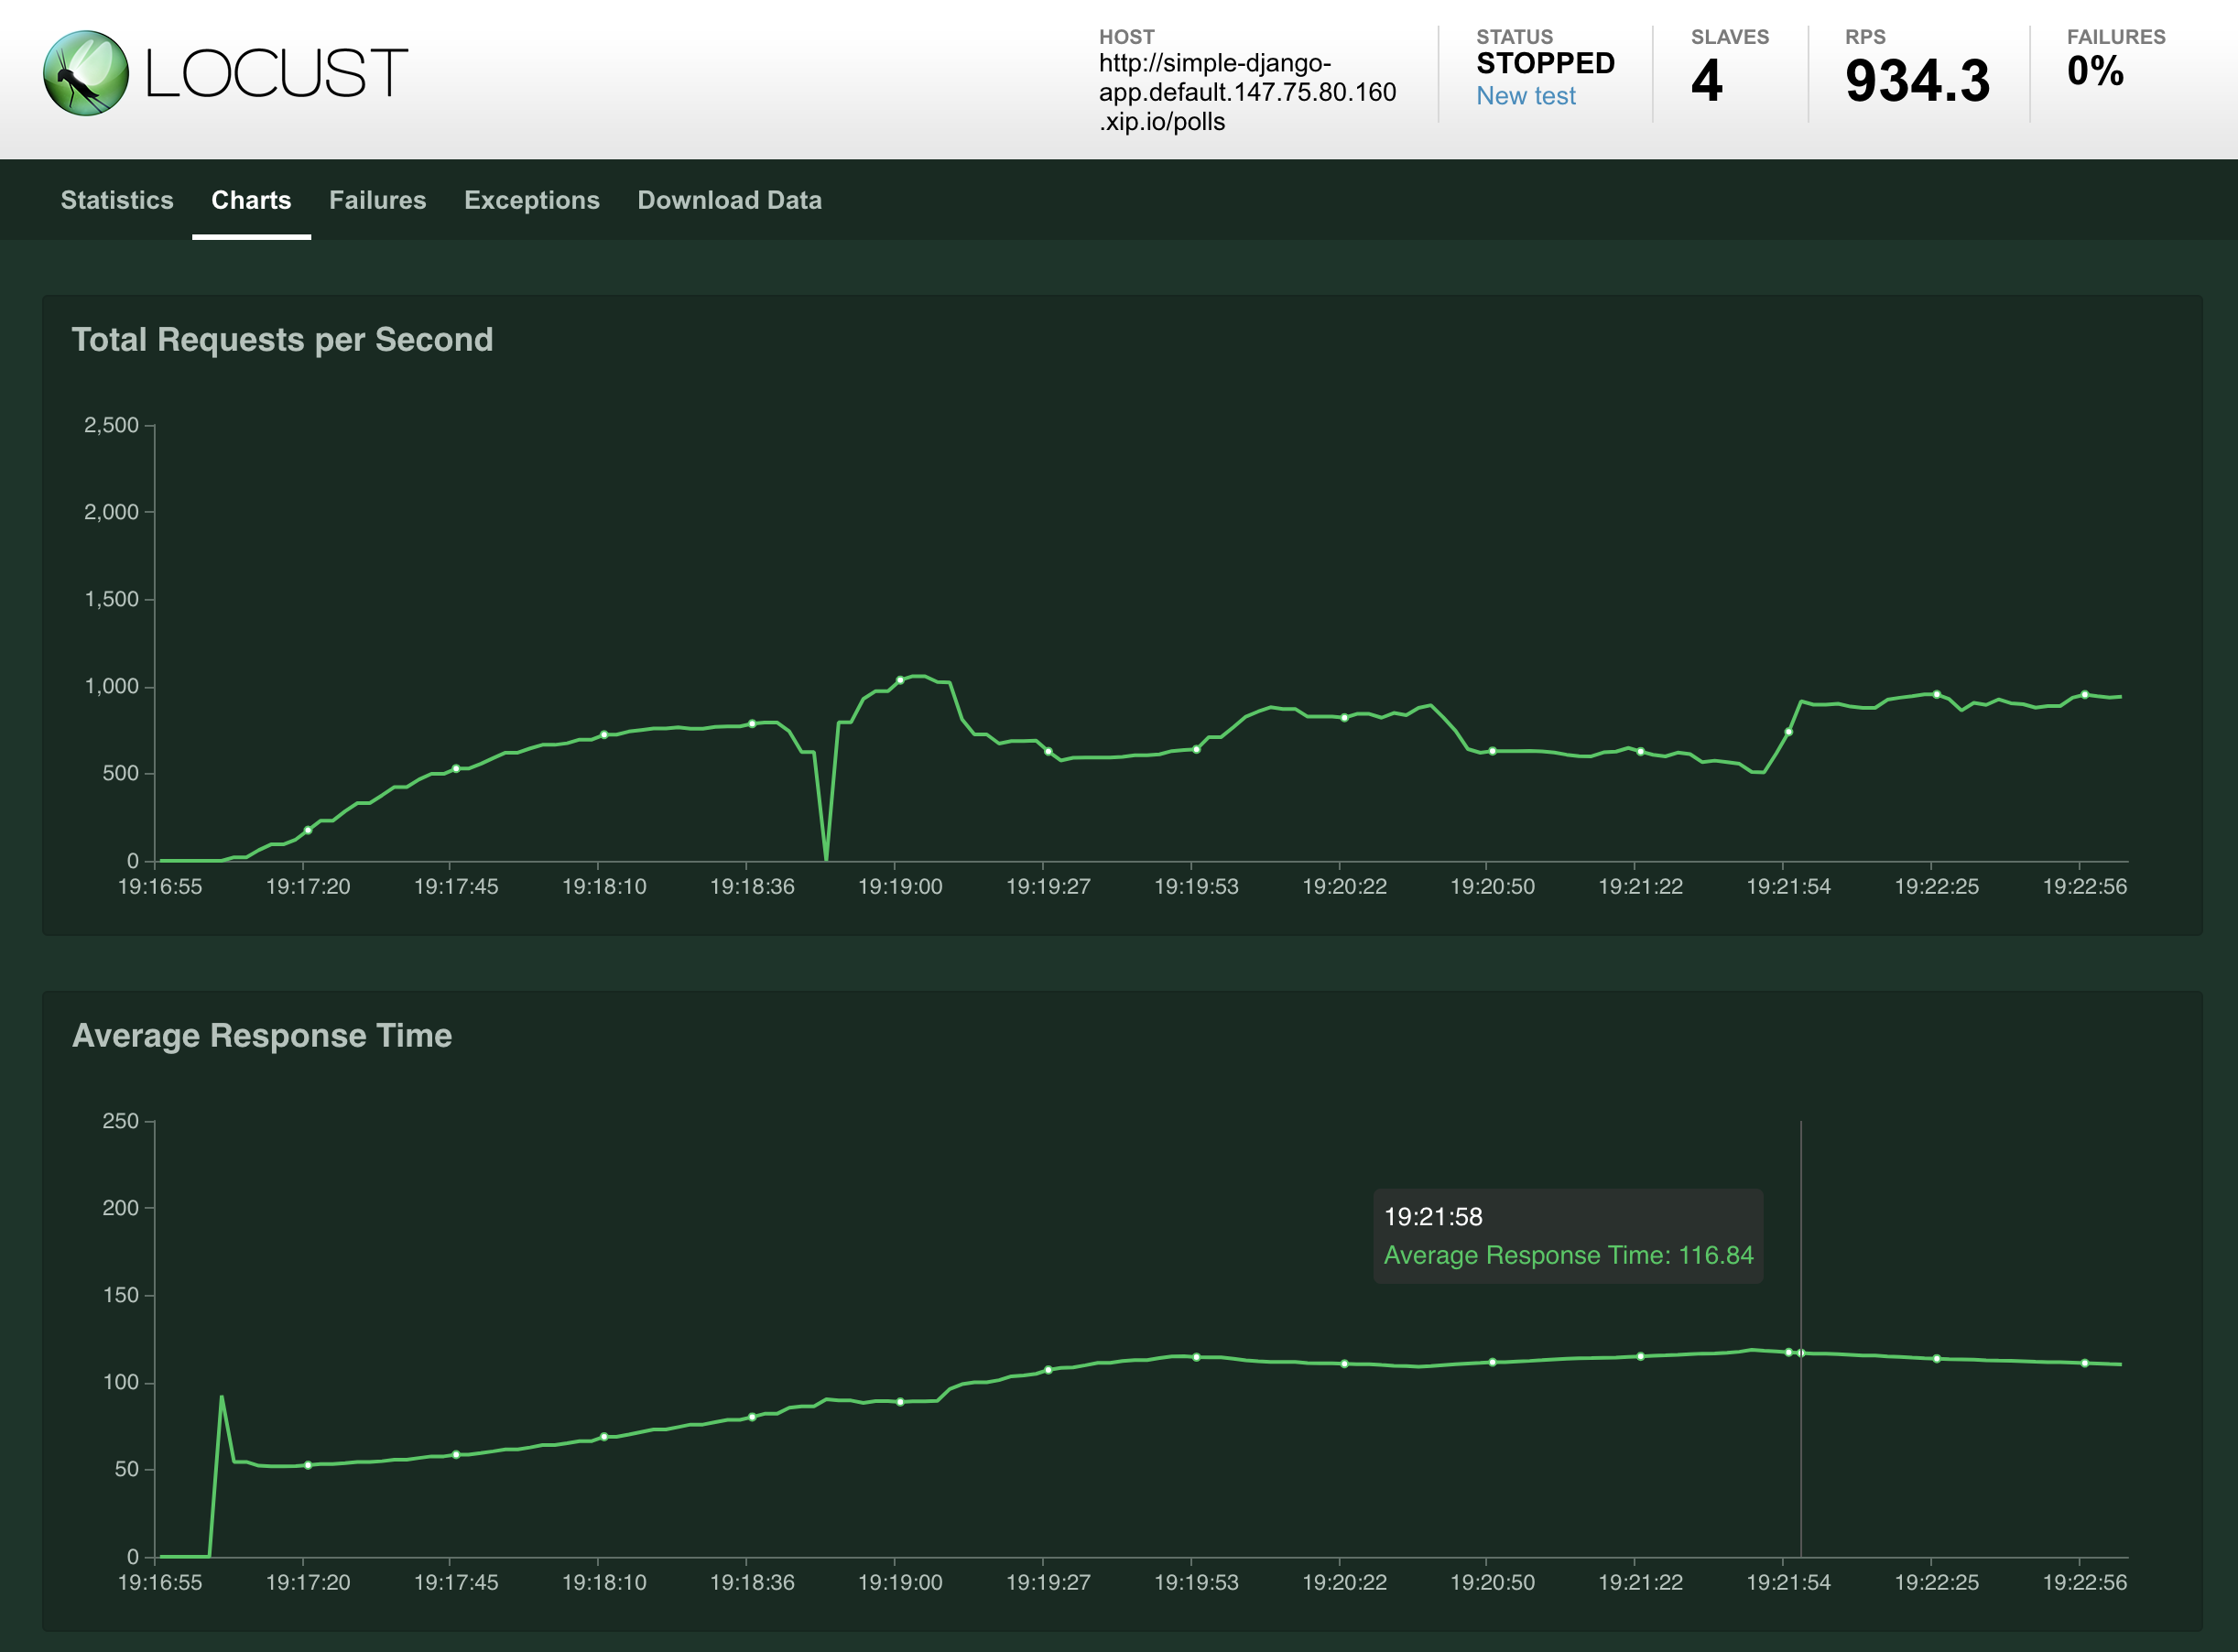
Let’s go further and start a Locust test. We’ll follow the instructions from zalando-incubator and start for replicas that will hit our service:
_________________________________________________________________________________

                         L O C A L - D E P L O Y M E N T
_________________________________________________________________________________
Target url: http://simple-django-app.default.147.75.80.160.xip.io/polls
Where load test script is stored (e.g. https://raw.githubusercontent.com/zalando-incubator/docker-locust/master/example/simple.py): https://raw.githubusercontent.com/zalando-incubator/docker-locust/master/example/simple.py
Number of slave(s): 4
Run type [automatic/manual]: manual
----------------------------------------------
                   VARIABLES
----------------------------------------------
TARGET_URL: http://simple-django-app.default.147.75.80.160.xip.io/polls
LOCUST_FILE: https://raw.githubusercontent.com/zalando-incubator/docker-locust/master/example/simple.py
SLAVES NUMBER: 4
RUN_TYPE: manual || automatic=false
NUMBER OF USERS:
HATCH_RATE:
DURATION [in seconds]:
COMPOSE: false
SEND_ANONYMOUS_USAGE_INFO: true
----------------------------------------------
And the results are pretty cool
╰─>$ kubectl get po -l serving.knative.dev/service=simple-django-app
NAME                                                  READY   STATUS      RESTARTS   AGE
simple-django-app-ns6fm-deployment-85cff985d5-249rj   2/2     Running     0          41s
simple-django-app-ns6fm-deployment-85cff985d5-2c6m9   2/2     Running     0          41s
simple-django-app-ns6fm-deployment-85cff985d5-2m6kk   2/2     Running     0          86s
simple-django-app-ns6fm-deployment-85cff985d5-2mm7t   2/2     Running     0          41s
simple-django-app-ns6fm-deployment-85cff985d5-2q7f8   2/2     Running     0          41s
simple-django-app-ns6fm-deployment-85cff985d5-5xcxf   2/2     Running     0          71s
simple-django-app-ns6fm-deployment-85cff985d5-6jxfw   2/2     Running     0          41s
simple-django-app-ns6fm-deployment-85cff985d5-77v6w   2/2     Running     0          41s
simple-django-app-ns6fm-deployment-85cff985d5-8qk5s   2/2     Running     0          56s
simple-django-app-ns6fm-deployment-85cff985d5-9n4h6   2/2     Running     0          41s
simple-django-app-ns6fm-deployment-85cff985d5-b466k   2/2     Running     0          7m57s
simple-django-app-ns6fm-deployment-85cff985d5-b8qbf   2/2     Running     0          25s
simple-django-app-ns6fm-deployment-85cff985d5-bkt66   2/2     Running     0          71s
simple-django-app-ns6fm-deployment-85cff985d5-bxbzf   2/2     Running     0          56s
simple-django-app-ns6fm-deployment-85cff985d5-d5xt5   2/2     Running     0          41s
simple-django-app-ns6fm-deployment-85cff985d5-jrchv   2/2     Running     0          41s
simple-django-app-ns6fm-deployment-85cff985d5-mtrvh   2/2     Running     0          56s
simple-django-app-ns6fm-deployment-85cff985d5-mzz7g   2/2     Running     0          41s
simple-django-app-ns6fm-deployment-85cff985d5-p7wvx   2/2     Running     0          41s
simple-django-app-ns6fm-deployment-85cff985d5-pbmzb   2/2     Running     0          25s
simple-django-app-ns6fm-deployment-85cff985d5-pzb92   2/2     Running     0          56s
simple-django-app-ns6fm-deployment-85cff985d5-pzkrr   2/2     Running     0          41s
simple-django-app-ns6fm-deployment-85cff985d5-qhjxq   2/2     Running     0          41s
simple-django-app-ns6fm-deployment-85cff985d5-rc2xx   2/2     Running     0          41s
simple-django-app-ns6fm-deployment-85cff985d5-s7lzm   2/2     Running     0          25s
simple-django-app-ns6fm-deployment-85cff985d5-sdpmf   2/2     Running     0          41s
simple-django-app-ns6fm-deployment-85cff985d5-ss66c   2/2     Running     0          6m27s
simple-django-app-ns6fm-deployment-85cff985d5-ssrzg   2/2     Running     0          56s
simple-django-app-ns6fm-deployment-85cff985d5-t424m   2/2     Running     0          56s
simple-django-app-ns6fm-deployment-85cff985d5-tjlsz   2/2     Running     0          71s
simple-django-app-ns6fm-deployment-85cff985d5-tzcjw   2/2     Running     0          56s
simple-django-app-ns6fm-deployment-85cff985d5-w2tsp   2/2     Running     0          71s
simple-django-app-ns6fm-deployment-85cff985d5-x9626   2/2     Running     0          41s
simple-django-app-ns6fm-deployment-85cff985d5-xm5pk   2/2     Running     0          86s
simple-django-app-ns6fm-deployment-85cff985d5-xv9sw   2/2     Running     0          56s
Requests leaving the local machine
Requests for this current revision
Resource consumption
For now, we have a running Kubernetes cluster, on bare-metal (on top of Packet), with 3 nodes, a running Knative installation that serves and scales Docker images.
Mysql
Finally, let’s add some state to this setup. At Presslabs, the company I’m currently working for, we’ve built an operator for MySQL. It takes care of replication, backups, and other tedious operations. The installation and its configuration are fairly straight forward, but first, we need to configure some persistent volumes:
apiVersion: v1
kind: PersistentVolume
metadata:
  labels:
    type: local
  name: rabbit-1.vtemian.com
spec:
  accessModes:
  - ReadWriteOnce
  capacity:
    storage: 11Gi
  hostPath:
    path: /mnt/data
    type: ""
  nodeAffinity:
    required:
      nodeSelectorTerms:
      - matchExpressions:
        - key: kubernetes.io/hostname
          operator: In
          values:
          - rabbit-1.vtemian.com
  persistentVolumeReclaimPolicy: Retain
  storageClassName: standard
  volumeMode: Filesystem
Let’s create one for each node:
╰─>$ kubectl get pv
NAME                   CAPACITY   ACCESS MODES   RECLAIM POLICY   STATUS      CLAIM                           STORAGECLASS   REASON   AGE
rabbit-1.vtemian.com   11Gi       RWO            Retain           Available                                   standard                2m58s
rabbit-2.vtemian.com   11Gi       RWO            Retain           Bound       default/data-mysql-operator-0   standard                3m9s
rabbit-3.vtemian.com   11Gi       RWO            Retain           Available                                   standard                3m19s
We now can continue with mysql-operator:
╰─>$ helm repo add presslabs https://presslabs.github.io/charts
╰─>$ helm install presslabs/mysql-operator --name mysql-operator --set orchestrator.persistence.storageClass=standard
Furthermore, we’ll need a secret with the credentials we want for our mysql cluster
apiVersion: v1
kind: Secret
metadata:
  name: my-secret
type: Opaque
data:
  ROOT_PASSWORD: bXlwYXNz
  DATABASE: cmFiYml0Cg==
  USER: cmFiYml0Cg==
  PASSWORD: bXlwYXNz
And create the cluster with 2 replicas
apiVersion: mysql.presslabs.org/v1alpha1
kind: MysqlCluster
metadata:
  name: my-cluster
spec:
  replicas: 2
  secretName: my-secret
Now we have our 2 replicas:
╰─>$ kubectl get po -l app.kubernetes.io/name=mysql
NAME                 READY   STATUS    RESTARTS   AGE
my-cluster-mysql-0   4/4     Running   0          3m11s
my-cluster-mysql-1   4/4     Running   0          4m37s
And a service on which we can connect:
╰─>$ kubectl get service -l app.kubernetes.io/name=mysql
NAME                      TYPE        CLUSTER-IP      EXTERNAL-IP   PORT(S)             AGE
my-cluster-mysql          ClusterIP   10.233.50.17    <none>        3306/TCP            10m
my-cluster-mysql-master   ClusterIP   10.233.29.255   <none>        3306/TCP            10m
At this point, the serving component is up and running and tested with a dummy application. Let’s move further with the building component.
CI/CD
Tekton
Knative used to have a build component, which now is deprecated in favour of Tekton. There are some nice guides on how to configure Tekton and integrate it with Knative, but first, let’s install it:
╰─>$ kubectl apply --filename https://storage.googleapis.com/tekton-releases/pipeline/latest/release.yaml
Finally, we just need to edit the config-artifact-pvc ConfigMap, in order to allow Tekton to save artifacts in a PVC.
data:
  size: 5Gi
  storageClassName: default
Taking a look at Tekton pod’s we can see that it’s running properly:
╰─>$ kubectl get po -n tekton-pipelines
NAME                                           READY   STATUS    RESTARTS   AGE
tekton-pipelines-controller-5c44bcfc44-gfhdx   1/1     Running   0          85m
tekton-pipelines-webhook-7bd568f6c6-vll6v      1/1     Running   0          85m
How does Tekton work?
Before setting up the pipeline, let’s explore Tekton a little bit. Tekton leverages CRDs and allow us to describe pipelines by defining Kubernetes resources. I’ll resume the information from this guide and their official docs.
Tasks are a template for defining an actual working unit. It’s like defining a function, with its parameters and behavior. It defines one or more steps and at each step, a container is executed. Example from https://github.com/knative-sample/tekton-knative
apiVersion: tekton.dev/v1alpha1
kind: Task
metadata:
  name: deploy-using-kubectl
spec:
  inputs:
    resources:
      - name: git-source
        type: git
    params:
      - name: pathToYamlFile
        description: The path to the yaml file to deploy within the git source
      - name: imageUrl
        description: Url of image repository
      - name: imageTag
        description: Tag of the images to be used.
        default: "latest"
  steps:
    - name: update-yaml
      image: alpine
      command: ["sed"]
      args:
        - "-i"
        - "-e"
        - "s;__IMAGE__;${inputs.params.imageUrl}:${inputs.params.imageTag};g"
        - "/workspace/git-source/${inputs.params.pathToYamlFile}"
    - name: run-kubectl
      image: registry.cn-hangzhou.aliyuncs.com/knative-sample/kubectl:v0.5.0
      command: ["kubectl"]
      args:
        - "apply"
        - "-f"
        - "/workspace/git-source/${inputs.params.pathToYamlFile}"
A TaskRun is a running instance of a Task. It executes all the steps of a task, in order, until all of them are completed. Example from https://github.com/knative-sample/tekton-knative
apiVersion: tekton.dev/v1alpha1
kind: TaskRun
metadata:
  name: source-to-image
spec:
  taskRef:
    name: source-to-image
  params:
    - name: pathToContext
      value: "${params.pathToContext}"
    - name: imageUrl
      value: "${params.imageUrl}"
    - name: imageTag
      value: "${params.imageTag}"
  resources:
    inputs:
      - name: git-source
        resource: git-source
A Pipeline allows us to define multiple tasks. Using TaskRun we could run only one task. Each Task in a Pipeline executes as a Pod. Example from https://github.com/knative-sample/tekton-knative
apiVersion: tekton.dev/v1alpha1
kind: Pipeline
metadata:
  name: build-and-deploy-pipeline
spec:
  resources:
    - name: git-source
      type: git
  params:
    - name: pathToContext
      description: The path to the build context, used by Kaniko - within the workspace
      default: src
    - name: pathToYamlFile
      description: The path to the yaml file to deploy within the git source
    - name: imageUrl
      description: Url of image repository
    - name: imageTag
      description: Tag to apply to the built image
  tasks:
  - name: source-to-image
    taskRef:
      name: source-to-image
    params:
      - name: pathToContext
        value: "${params.pathToContext}"
      - name: imageUrl
        value: "${params.imageUrl}"
      - name: imageTag
        value: "${params.imageTag}"
    resources:
      inputs:
        - name: git-source
          resource: git-source
  - name: deploy-to-cluster
    taskRef:
      name: deploy-using-kubectl
    runAfter:
      - source-to-image
    params:
      - name: pathToYamlFile
        value:  "${params.pathToYamlFile}"
      - name: imageUrl
        value: "${params.imageUrl}"
      - name: imageTag
        value: "${params.imageTag}"
    resources:
      inputs:
        - name: git-source
          resource: git-source
Similar to TaskRun, PipelineRun executes all the tasks defined in a Pipeline. Example from https://github.com/knative-sample/tekton-knative
apiVersion: tekton.dev/v1alpha1
kind: PipelineRun
metadata:
  generateName: tekton-kn-sample-
spec:
  pipelineRef:
    name: build-and-deploy-pipeline
  resources:
    - name: git-source
      resourceRef:
        name: tekton-knative-git
  params:
    - name: pathToContext
      value: "src"
    - name: pathToYamlFile
      value: "knative/helloworld-go.yaml"
    - name: imageUrl
      value: "registry.cn-hangzhou.aliyuncs.com/knative-sample/tekton-knative-helloworld"
    - name: imageTag
      value: "1.0"
  trigger:
    type: manual
  serviceAccount: pipeline-account
PipelineResources allows us to define objects that are used by tasks’ inputs and outputs. Example from https://github.com/knative-sample/tekton-knative
apiVersion: tekton.dev/v1alpha1
kind: PipelineResource
metadata:
  name: tekton-knative-git
spec:
  type: git
  params:
    - name: revision
      value: master
    - name: url
      value: https://github.com/knative-sample/tekton-knative
Pipeline setup
Those are all the major components that we’ll play with.
Let’s create a new namespace called ci and install the above manifests, adapted for our needs. I’ve commited the changes in the example app.
╰─>$ kubectl get po
NAME                                                           READY   STATUS      RESTARTS   AGE
tekton-simple-django-app-1-deploy-to-cluster-982xv-pod-kkmpw   0/3     Completed   0          3m18s
tekton-simple-django-app-1-source-to-image-8c47t-pod-ccc44     0/3     Completed   0          3m44s
╰─>$ kubectl get pipelinerun
NAME                         SUCCEEDED   REASON      STARTTIME   COMPLETIONTIME
tekton-simple-django-app-1   True        Succeeded   2m14s       95s
Github webhook trigger
Right now, we manually have to trigger the build by deleting and re-creating the Pipelinerun resource. Let’s try to automate it, by configuring a Github webhook that will ping the building process each time a new commit is made.
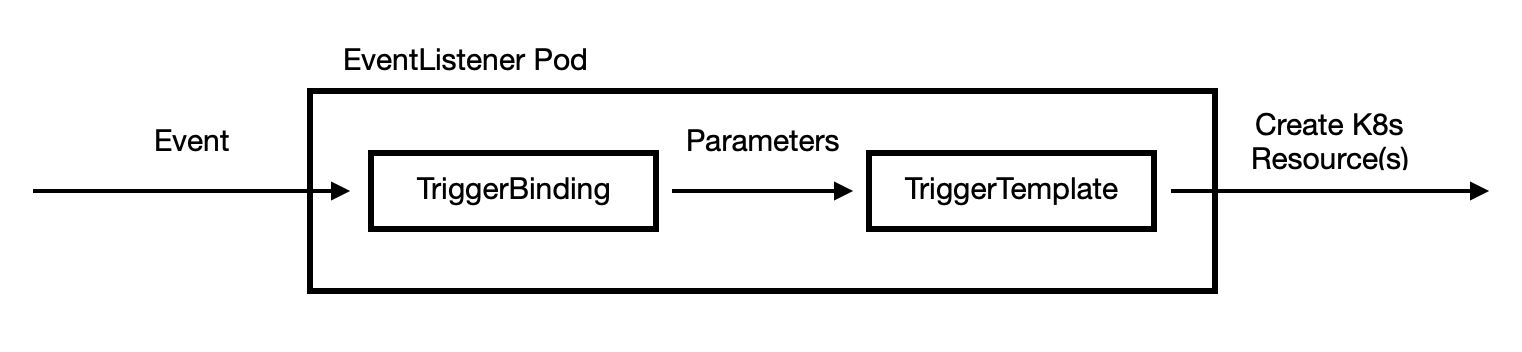
The setup for that is not too complex, nor too simple. When a github hook arrives, it lands in an [EventListener](https://tekton.dev/docs/triggers/eventlisteners/) pod (that will need to be exposed to the Internet via Istio). From its payload, we’ll need to extract relevant parameters, like commit information. For that, we’ll be using TriggerBindings. The parameters are then used by TriggerTemplate to generate our pipeline run. The following configurations are inspired by @nikhilthomas1.
Let’s create the a role, service account and the role binding for this process.
---
apiVersion: rbac.authorization.k8s.io/v1
kind: Role
rules:
- apiGroups:
  - triggers.tekton.dev
  resources:
  - eventlisteners
  - triggerbindings
  - triggertemplates
  - pipelineresources
  verbs:
  - get
- apiGroups:
  - triggers.tekton.dev
  resources:
  - pipelineruns
  - pipelineresources
  verbs:
  - create
- apiGroups:
  - ""
  resources:
  - configmaps
  verbs:
  - get
  - list
  - create
  - update
  - delete
---
apiVersion: v1
kind: ServiceAccount
metadata:
  name: tekton-triggers-sa
---
apiVersion: rbac.authorization.k8s.io/v1
kind: RoleBinding
metadata:
  name: tekton-triggers-rolebinding
subjects:
- kind: ServiceAccount
  name: tekton-triggers-sa
roleRef:
  apiGroup: rbac.authorization.k8s.io
  kind: Role
  name: tekton-triggers-role⏎
TriggerTemplate is very basic. It describes some parameters that can be used, from the binding and it patches them together with PipelineRun and other resources:
apiVersion: triggers.tekton.dev/v1alpha1
kind: TriggerTemplate
metadata:
  name: tekton-triggertemplate
spec:
  params:
  - name: gitrevision
    description: The git revision
    default: master
  - name: gitrepositoryurl
    description: The git repository url
  - name: namespace
    description: The namespace to create the resources
  - name: gitrepositoryname
    description: The name of the deployment to be created / patched
  resourcetemplates:
  - apiVersion: tekton.dev/v1alpha1
    kind: PipelineResource
    metadata:
      name: source-repo-$(params.gitrepositoryname)-$(uid)
      namespace: $(params.namespace)
    spec:
      type: git
      params:
      - name: revision
        value: $(params.gitrevision)
      - name: url
        value: $(params.gitrepositoryurl)
  - apiVersion: tekton.dev/v1alpha1
    kind: PipelineRun
    metadata:
      name: teokton-build-$(params.gitrepositoryname)-$(uid)
      namespace: $(params.namespace)
    spec:
      pipelineRef:
        name: build-and-deploy-pipeline
      serviceAccountName: pipeline-account
      resources:
      - name: git-source
        resourceRef:
          name: source-repo-$(params.gitrepositoryname)-$(uid)
      params:
      - name: pathToContext
        value: ""
      - name: pathToDockerFile
        value: Dockerfile
      - name: pathToYamlFile
        value: knative.yaml
      - name: imageUrl
        value: docker.io/vtemian/$(params.gitrepositoryname)
      - name: imageTag
        value: latest
Our TriggerBinding will also be pretty simple. Just a mapping from Github’s payload to the parameters used in TriggerTemplate
apiVersion: triggers.tekton.dev/v1alpha1
kind: TriggerBinding
metadata:
  name: tekton-pipelinebinding
spec:
  params:
  - name: gitrevision
    value: $(body.head_commit.id)
  - name: namespace
    value: default
  - name: gitrepositoryurl
    value: $(body.repository.url)
  - name: gitrepositoryname
    value: $(body.repository.name)
Finally, we’ll need the EventListener, with binds a TemplateTrigger with a TemplateBinding
apiVersion: triggers.tekton.dev/v1alpha1
kind: EventListener
metadata:
  name: el-tekton-listener
spec:
  serviceAccountName: tekton-triggers-sa
  triggers:
  - bindings:
      - name: tekton-pipelinebinding
    template:
      name: tekton-triggertemplate
╰─>$ kubectl get service | grep tek
el-tekton-listener                ClusterIP      10.233.47.3     <none>                                                 8080/TCP                             114m
Now that we have the service, we’ll just need to expose it using Istio’s primitives. Let’s use Tekton’s tools for that, using a separate service account:
kind: Role
apiVersion: rbac.authorization.k8s.io/v1
metadata:
  name: tekton-triggers-createwebhook
rules:
- apiGroups:
  - ""
  resources:
  - secrets
  verbs:
  - get
  - list
  - create
  - update
  - delete
- apiGroups:
  - tekton.dev
  resources:
  - eventlisteners
  verbs:
  - get
  - list
  - create
  - update
  - delete
- apiGroups:
  - extensions
  resources:
  - ingresses
  verbs:
  - create
  - get
  - list
  - delete
  - update
---
apiVersion: v1
kind: ServiceAccount
metadata:
  name: tekton-triggers-createwebhook
---
apiVersion: rbac.authorization.k8s.io/v1
kind: RoleBinding
metadata:
  name: tekton-triggers-createwebhook
subjects:
- kind: ServiceAccount
  name: tekton-triggers-createwebhook
roleRef:
  apiGroup: rbac.authorization.k8s.io
  kind: Role
  name: tekton-triggers-createwebhook⏎
Following by the task itself:
apiVersion: tekton.dev/v1beta1
kind: Task
spec:
  params:
  - description: The external domain for the EventListener
    name: ExternalDomain
    type: string
  - description: The name of the Service used in the VirtualService
    name: Service
    type: string
  - description: The service port that the VirtualService is being created on
    name: ServicePort
    type: string
  steps:
  - args:
    - -ce
    - |
      set -ex
      cat << EOF | kubectl create -f -
      apiVersion: networking.istio.io/v1alpha3
      kind: Gateway
      metadata:
        name: $(inputs.params.Service)-gateway
      spec:
        selector:
          istio: ingressgateway
        servers:
        - port:
            number: 80
            name: http-$(inputs.params.Service)
            protocol: HTTP
          hosts:
          - $(inputs.params.ExternalDomain)
      ---
      apiVersion: networking.istio.io/v1alpha3
      kind: VirtualService
      metadata:
        name: $(inputs.params.Service)-virtual-service
      spec:
        hosts:
        - $(inputs.params.ExternalDomain)
        gateways:
        - $(inputs.params.Service)-gateway
        http:
        - route:
          - destination:
              host: $(inputs.params.Service)
              port:
                number: $(inputs.params.ServicePort)
      EOF
    command:
    - sh
    image: lachlanevenson/k8s-kubectl:latest
    name: create-istio-gateway-virtualservice
    resources: {}
  volumes:
  - emptyDir: {}
    name: work
And ending with it’s initialisation:
apiVersion: tekton.dev/v1beta1
kind: TaskRun
metadata:
spec:
  params:
  - name: ExternalDomain
    value: simple-django-app-event-listner.default.147.75.80.160.xip.io
  - name: Service
    value: el-tekton-listener
  - name: ServicePort
    value: "8080"
  serviceAccountName: tekton-triggers-createwebhook
  taskRef:
    kind: Task
    name: create-istio-gateway-virtualservice
  timeout: 1h0m0s
And let’s check the result:
╰─>$ kubectl get VirtualService
NAME                                 GATEWAYS                                                          HOSTS                                                                                                                                                  AGE
el-tekton-listener-virtual-service   [el-tekton-listener-gateway]                                      [simple-django-app-event-listner.default.147.75.80.160.xip.io]
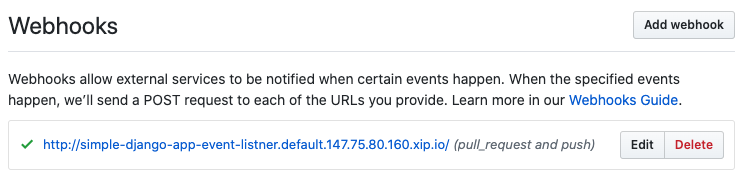
Now that we have the tools up and running in our cluster, we can create the webhook. For that, we’ll need a Github personal token, stored in a secret
apiVersion: v1
kind: Secret
metadata:
  name: webhook-secret
stringData:
  #https://help.github.com/en/github/authenticating-to-github/creating-a-personal-access-token-for-the-command-line#creating-a-token
  token: <token>
  secret: random-string-data
The task that will actually create the webhook
apiVersion: tekton.dev/v1alpha1
kind: Task
metadata:
  name: create-webhook
spec:
  volumes:
  - name: github-secret
    secret:
      secretName: $(inputs.params.GitHubSecretName)
  inputs:
    params:
    - name: ExternalDomain
      description: "The external domain for the EventListener e.g. `$(inputs.params.EventListenerName).<PROXYIP>.nip.io`"
    - name: GitHubUser
      description: "The GitHub user"
    - name: GitHubRepo
      description: "The GitHub repo where the webhook will be created"
    - name: GitHubOrg
      description: "The GitHub organization where the webhook will be created"
    - name: GitHubSecretName
      description: "The Secret name for GitHub access token. This is always mounted and must exist"
    - name: GitHubAccessTokenKey
      description: "The GitHub access token key name"
    - name: GitHubSecretStringKey
      description: "The GitHub secret string key name"
    - name: GitHubDomain
      description: "The GitHub domain. Override for GitHub Enterprise"
      default: "github.com"
    - name: WebhookEvents
      description: "List of events the webhook will send notifications for"
      default: '[\"push\",\"pull_request\"]'
  steps:
  - name: create-webhook
    image: pstauffer/curl:latest
    volumeMounts:
    - name: github-secret
      mountPath: /var/secret
    command:
    - sh
    args:
    - -ce
    - |
      set -e
      echo "Create Webhook"
      if [ $(inputs.params.GitHubDomain) = "github.com" ];then
        curl -v -d "{\"name\": \"web\",\"active\": true,\"events\": $(inputs.params.WebhookEvents),\"config\": {\"url\": \"$(inputs.params.ExternalDomain)\",\"content_type\": \"json\",\"insecure_ssl\": \"1\" ,\"secret\": \"$(cat /var/secret/$(inputs.params.GitHubSecretStringKey))\"}}" -X POST -u $(inputs.params.GitHubUser):$(cat /var/secret/$(inputs.params.GitHubAccessTokenKey)) -L https://api.github.com/repos/$(inputs.params.GitHubOrg)/$(inputs.params.GitHubRepo)/hooks
      else
        curl -d "{\"name\": \"web\",\"active\": true,\"events\": $(inputs.params.WebhookEvents),\"config\": {\"url\": \"$(inputs.params.ExternalDomain)/\",\"content_type\": \"json\",\"insecure_ssl\": \"1\" ,\"secret\": \"$(cat /var/secret/$(inputs.params.GitHubSecretStringKey))\"}}" -X POST -u $(inputs.params.GitHubUser):$(cat /var/secret/$(inputs.params.GitHubAccessTokenKey)) -L https://$(inputs.params.GitHubDomain)/api/v3/repos/$(inputs.params.GitHubOrg)/$(inputs.params.GitHubRepo)/hooks
      fi
And it’s initialization
apiVersion: tekton.dev/v1alpha1
kind: TaskRun
metadata:
  name: create-api-repo-webhook-run
spec:
  taskRef:
    name: create-webhook
  inputs:
    params:
    - name: GitHubOrg
      value: "vtemian"
    - name: GitHubUser
      value: "vtemian"
    - name: GitHubRepo
      value: "simple-django-app"
    - name: GitHubSecretName
      value: webhook-secret
    - name: GitHubAccessTokenKey
      value: token
    - name: GitHubSecretStringKey
      value: secret
    - name: ExternalDomain
      value: http://simple-django-app-event-listner.default.147.75.80.160.xip.io
  timeout: 1000s
  serviceAccountName: tekton-triggers-createwebhook
Now, each time we push new changes, a new build is being trigger:
╰─>$ kubectl get po | grep teo
teokton-build-simple-django-app-2fcdr-source-to-image-v86-mwxhw   0/3     Error       0          71m
teokton-build-simple-django-app-qlw5w-source-to-image-sz2-gpqdm   0/3     Error       0          73m
teokton-build-simple-django-app-sl9zf-source-to-image-knl-tzxpk   1/3     Running     0          18s
teokton-build-simple-django-app-xh54x-deploy-to-cluster-b-5p7r4   0/3     Completed   0          66m
teokton-build-simple-django-app-xh54x-source-to-image-wv5-9bsdt   0/3     Completed   0          66m
And the application is being deployed
╰─>$ kubectl get po | grep simple
simple-django-app-cjx8b-deployment-7cd5c5999d-vwjhv               2/2     Running     0          4h3m
simple-django-app-d2n6n-deployment-77c664bf4f-pz6hg               2/2     Running     0          4h29m
simple-django-app-hcmpl-deployment-7687b96b5f-pv2wz               2/2     Running     0          67m
Conclusions
In the end, we’ve managed to configure a bare-metal infrastructure, install Knative and have a CI/CD that builds and deploys new versions of our application, on git push. It’s a little bit of a hassle and we left behind some details regarding revisions, routing and blue-green deployments.
Platforms like Vercel, Heroku, Google Cloud Run and AWS ECS are truly remarkable, from an engineering point of view and because they lift the burden of deploying your application and manage your infrastructure. Kudos to Knative and Tekton for bringing such platforms closer to our reach.
Cheers 🍺!
Thanks @catileptic for the awesome illustrations!